Drawdown
Quick definition
Drawdown: Drawdown is the drop in your account equity from a peak to the following trough, usually shown as a percentage. If your account falls from $10,000 to $8,000 before recovering, that is a 20% drawdown. Maximum drawdown is the largest peak-to-trough fall on record, measuring the worst losing stretch a strategy has put you through.
Drawdown is the drop in your account from a peak to the low point that follows, before a new peak is reached. It is usually shown as a percentage. If your account climbs to $10,000 and then falls to $8,000 before recovering, you went through a 20% drawdown. Where returns tell you how much a strategy makes, drawdown tells you how much it hurts along the way, and it is often the difference between a strategy you can stick with and one you abandon at the worst possible moment.
How Drawdown Works
Drawdown is measured from your high-water mark, the highest your equity has ever been, down to the lowest point before you set a new high:
Drawdown % = (Peak Equity − Trough Equity) ÷ Peak Equity × 100
If your balance peaks at $25,000 and slides to $20,000, the drawdown is ($25,000 − $20,000) ÷ $25,000 = 20%. The drawdown is only over once your equity makes a new high above the old peak; until then, you are still in it.
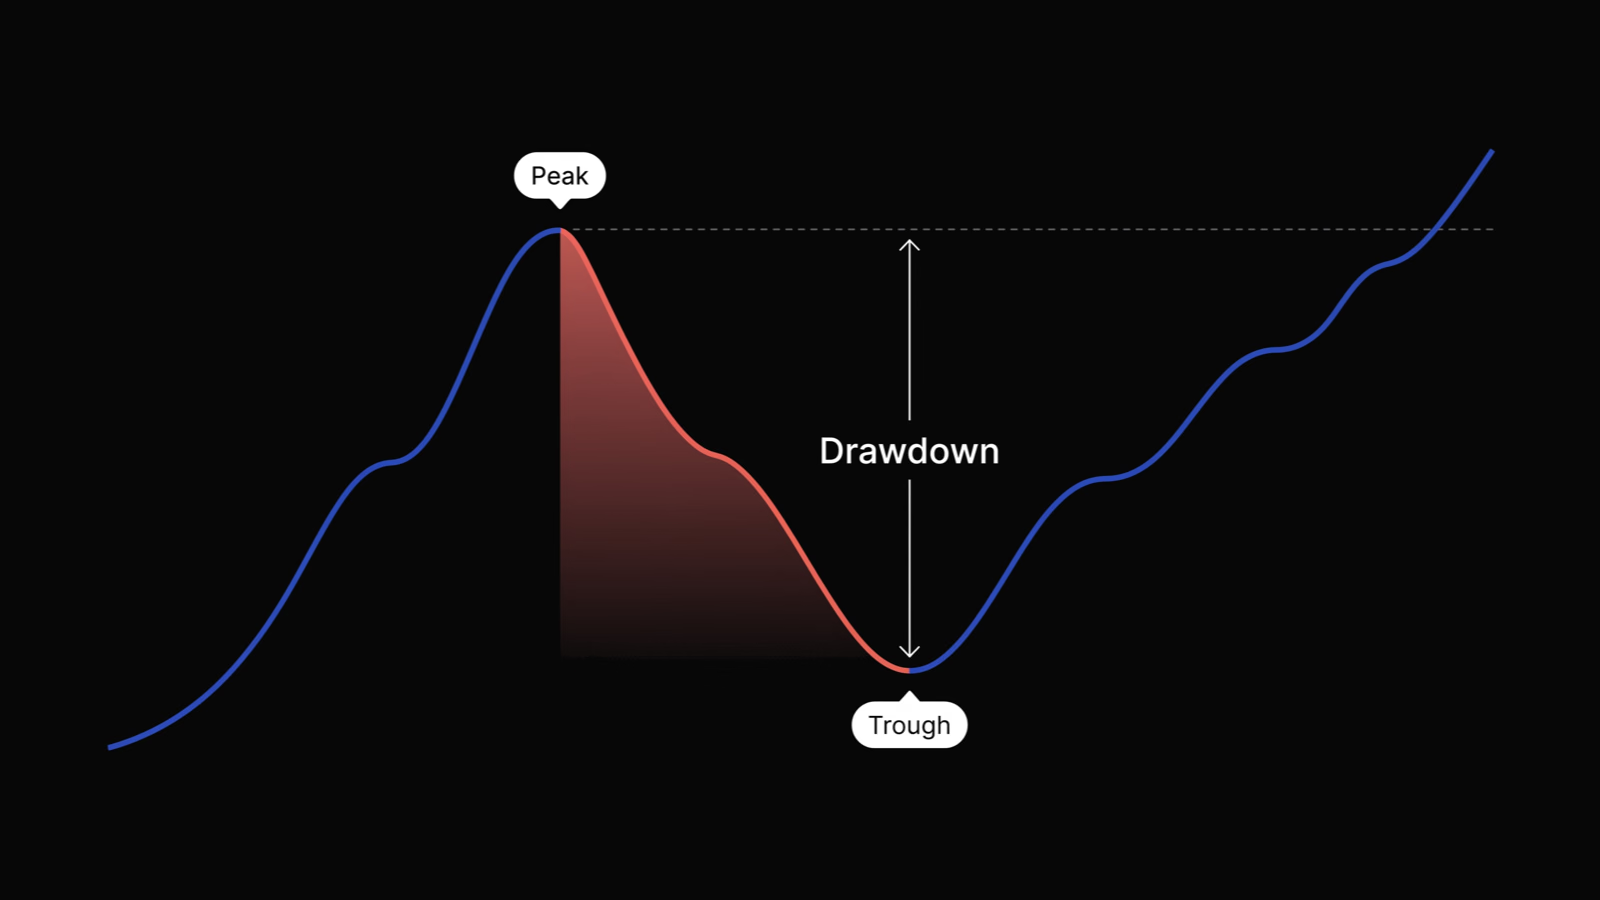
The part that surprises new traders is the recovery math. Because a loss shrinks the base you have to grow back from, getting even takes a bigger percentage gain than the percentage you lost:
| Drawdown | Gain needed to recover |
|---|---|
| 10% | 11.1% |
| 20% | 25% |
| 33% | 50% |
| 50% | 100% |
| 75% | 300% |
A 50% drawdown does not need a 50% gain to recover, it needs 100%. That asymmetry is why protecting against deep drawdowns matters more than chasing the next big winner.
Maximum Drawdown
Maximum drawdown is the largest peak-to-trough decline in your entire history, the deepest hole the strategy has put you in so far. It is the headline risk number, because it answers the question that keeps traders up at night: what is the worst it has ever gotten? A strategy that returns 30% a year with a 10% maximum drawdown is a very different proposition from one that returns 30% with a 40% maximum drawdown, even though the returns match. The second one is far harder to hold through.
Why Drawdown Matters
Drawdown is where strategy meets psychology. The numbers can be sound and you can still quit during a deep drawdown, locking in the loss right before the recovery. Three reasons to watch it closely:
- It sets your real risk. A deep enough drawdown is risk of ruin, the point where the account is too damaged to recover. Position sizing exists mostly to keep drawdowns survivable.
- It tests your discipline. Knowing your typical drawdown in advance makes a losing streak feel normal instead of like proof your edge is broken, which is when traders abandon a working plan or revenge-trade.
- It puts returns in context. A return means little without the expectancy and the drawdown behind it. Reward is only impressive relative to the worst-case pain it took to earn.
Key Takeaways
- Drawdown is the peak-to-trough drop in equity, usually shown as a percentage of the prior peak.
- Maximum drawdown is the largest such drop on record, the standard worst-case risk measure.
- Recovering from a drawdown takes a larger percentage gain than the loss, so deep drawdowns are disproportionately damaging.
- Read drawdown next to returns and profit factor; a strategy is only as good as the drawdown you can survive.
Common Mistakes
The most common mistake is focusing only on returns and ignoring drawdown, which is exactly how traders end up in strategies they cannot emotionally hold. Another is confusing a single losing trade with a drawdown; drawdown is the cumulative decline across a string of trades and open positions, not one red day. The third is increasing size after a drawdown to win the money back faster, which deepens the hole when the streak continues. Drawdowns are recovered by sticking to a positive-expectancy process, not by pressing harder.
How JournalX Tracks Drawdown
JournalX charts your equity curve and tracks drawdown straight from your logged trades, including your current drawdown and your maximum drawdown to date. You can see how deep past declines ran and how long they took to recover, and filter the view by account or setup to find where the deepest holes come from. Seen next to expectancy, win rate, and profit factor, drawdown turns from a number you fear into one you plan around.
Related terms
Frequently asked questions
What is a good drawdown in trading?
Lower is better, but a good drawdown is one you can survive both financially and emotionally while staying with your plan. Many traders treat a maximum drawdown beyond 20% to 30% as a warning to cut risk. The right number depends on your strategy and risk tolerance, not a universal threshold.
What is the difference between drawdown and maximum drawdown?
Drawdown is any peak-to-trough decline in your equity. Maximum drawdown is the single largest of those declines across your whole history, used as the standard worst-case risk measure for a strategy.
How do you calculate drawdown?
Subtract the trough equity from the prior peak equity, divide by the peak, and multiply by 100. If your account fell from $20,000 to $16,000, that is a ($20,000 − $16,000) ÷ $20,000 × 100 = 20% drawdown.
Why does drawdown matter more than returns?
Returns tell you the upside; drawdown tells you the pain and the risk of ruin it took to get there. Because recovering from a deep drawdown needs a disproportionately large gain, and because traders tend to quit at the bottom, the drawdown you can survive often decides whether you ever see the returns.