R-Multiple
Quick definition
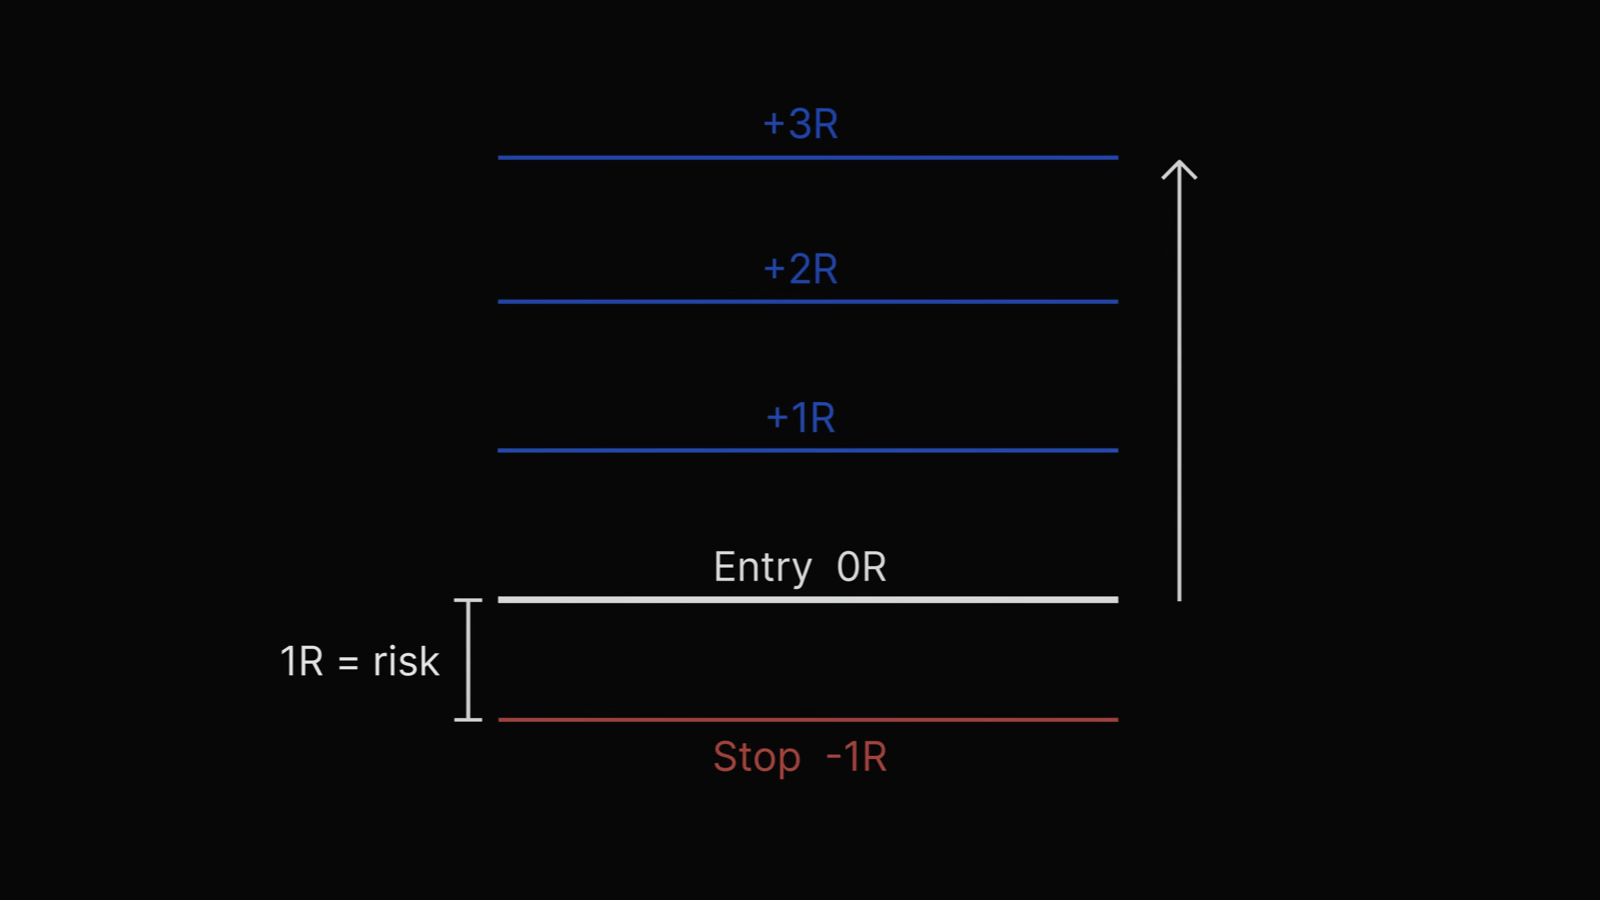
R-Multiple: An R-multiple expresses a trade's result as a multiple of the amount you risked. Your initial risk, the distance from entry to stop, equals 1R. Risk $100 and make $300, and the trade is +3R; lose the full $100, and it is −1R. R-multiples let you compare trades of any size on one scale.
R-multiple is a way of measuring a trade's result in units of risk instead of dollars. The R stands for risk: the amount you put on the line when you entered, measured as the distance from your entry to your stop-loss. That initial risk is 1R. If you risk $100 and the trade makes $300, the result is +3R. If it hits your stop and you lose the $100, it is −1R. Expressing every trade in R lets you compare a tiny position and a large one on exactly the same scale.
How R-Multiples Work
Your R is set the moment you enter a trade, by where you place your stop:
1R = the dollars you stand to lose if your stop is hit (entry price − stop price, per unit)
From there, every outcome is just a multiple of that risk:
- Stop gets hit: −1R
- You exit at twice your risk: +2R
- You cut a loser early, at half your risk: −0.5R
- You let a winner run to five times your risk: +5R
Say you buy a stock at $50 with a stop at $48. Your risk is $2 per share, so 1R = $2. If you sell at $56, you made $6 per share, which is +3R. The dollar size depends on how many shares you traded, but the R-multiple, +3R, is the same whether you bought 10 shares or 10,000.
Why Traders Think in R
Measuring results in R, rather than dollars, does three useful things:
- It standardizes every trade. A +2R day trade and a +2R swing trade are comparable, even if one risked $50 and the other $5,000.
- It takes the emotion out of the number. Thinking in R keeps you focused on process and risk rather than the dollar swing, which is where discipline tends to break.
- It makes your edge measurable. Average your R-multiples across many trades and you get your expectancy in R, the cleanest single measure of whether a strategy has an edge.
How to Calculate Your R-Multiple
To get the R-multiple of a closed trade, divide its profit or loss by the amount you originally risked:
R-Multiple = Trade Profit or Loss ÷ Initial Risk (1R)
If your initial risk was $200 and you made $500, that is $500 ÷ $200 = +2.5R. If you lost $150 against a $200 risk, that is −$150 ÷ $200 = −0.75R, meaning you got out before your full stop. The one rule that keeps R honest: fix your 1R at entry, and do not redefine it afterward.
R-Multiples and Expectancy
R is the unit that makes expectancy portable across setups and account sizes. If your average winner is +2R, your average loser is −1R, and you win 40% of the time, your expectancy is (0.40 × 2) − (0.60 × 1) = +0.2R per trade. You expect to earn a fifth of your risk on every trade, on average. A trader who only knows their dollar P&L cannot compare setups this cleanly, because the dollar amounts hide the risk behind them.
Key Takeaways
- R-multiple expresses a trade's result as a multiple of the risk you took, where 1R is your entry-to-stop distance.
- A full stop-out is −1R; a trade that makes twice your risk is +2R, regardless of position size.
- Thinking in R standardizes trades, removes dollar emotion, and lets you measure your edge cleanly.
- Always fix your 1R at entry; moving your stop after the fact corrupts every R-multiple that follows.
Common Mistakes
The most damaging mistake is trading without a defined stop, which leaves 1R undefined and makes R-multiples impossible to calculate honestly. Close behind is moving your stop wider mid-trade: that quietly increases your real risk, so a −1R on paper becomes a −2R or −3R in reality. Traders also confuse R-multiple with reward-to-risk ratio. Reward-to-risk is your planned target before the trade (a 3:1 plan); R-multiple is the actual result after it (you planned 3:1 but exited at +1.4R).
How JournalX Tracks R-Multiples
When you set an entry and a stop in JournalX, it captures your 1R and reports every trade's result in R alongside dollars. Because pre-trade planning is built in, you can record the reward-to-risk you intended and compare it to the R-multiple you actually realized, trade by trade. Average those R-multiples by setup and you get your expectancy in R, so you can see which strategies genuinely pay you back more than they risk. Pair it with win rate and profit factor for the full picture.
Related terms
Frequently asked questions
What does R mean in trading?
R stands for risk, the amount you commit to a trade, measured as the distance from your entry to your stop-loss. It is your baseline unit, so a trade that loses exactly your planned risk is −1R, and one that makes twice your risk is +2R.
How do you calculate an R-multiple?
Divide the trade's profit or loss by the amount you originally risked. If you risked $200 and made $600, the trade is +3R. If you lost $100 against a $200 risk, it is −0.5R. Set your 1R at entry and never change it afterward.
What is a good average R-multiple?
It depends on your win rate. A trader who wins half their trades only needs an average winner above 1R to come out ahead. What matters is that your average R-multiple across all trades, your expectancy in R, stays positive over a large sample.
Why use R-multiples instead of dollars?
Dollars change with position size, so they make trades hard to compare and tie your judgment to the money on the line. R-multiples normalize every trade to the risk you took, which keeps you focused on process and lets you measure your edge across setups of any size.