Risk-Reward Ratio
Quick definition
Risk-Reward Ratio: The risk-reward ratio compares how much you stand to lose on a trade to how much you aim to gain. Risk $100 to make $300 and your ratio is 1:3. You set it before you enter, from your stop and target, and it decides how often you need to be right just to break even.
The risk-reward ratio compares the amount you stand to lose on a trade against the amount you aim to make. You set it before you enter, from the distance between your entry and your stop-loss (the risk) and the distance between your entry and your target (the reward). Risk $100 to make $300 and your risk-reward ratio is 1:3. It is one of the few numbers you control completely on every trade, and it decides how often you need to be right just to break even.
How the Risk-Reward Ratio Works
The ratio is your potential loss set against your potential gain, measured in the same units (usually dollars or points):
Risk-Reward Ratio = Amount Risked : Amount Targeted
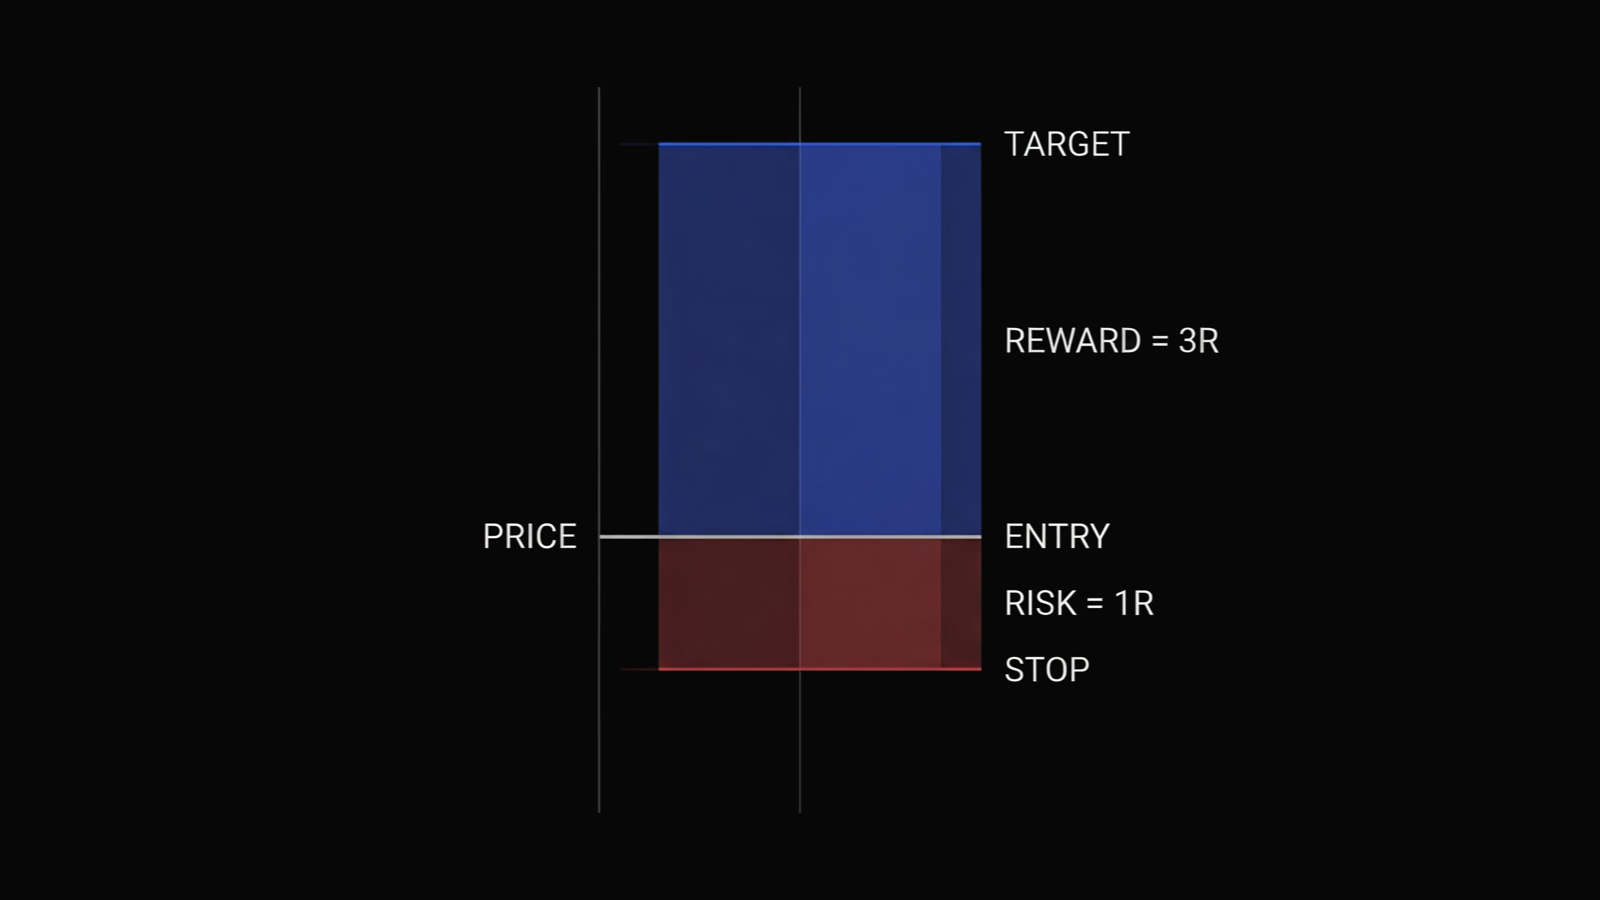
Say you buy a stock at $50, place your stop at $48, and set your target at $56. You are risking $2 per share to make $6 per share, a risk-reward ratio of 1:3. The size of the position does not change the ratio, only the stop and target do.
One point of confusion is worth clearing up. Some traders write the risk first (1:3, risk 1 to make 3) and others write the reward first and call it reward-to-risk (3:1). They describe the same trade. Throughout JournalX we put risk first, so a 1:3 risk-reward and a 3:1 reward-to-risk mean the same thing, three units of reward for every one unit of risk.
Risk-Reward and Win Rate
The reason the risk-reward ratio matters so much is that it sets your breakeven win rate, the percentage of trades you need to win just to avoid losing money. The bigger your target relative to your risk, the fewer trades you need to win.
Breakeven Win Rate = Risk ÷ (Risk + Reward)
| Risk-reward ratio | Win rate you need to break even |
|---|---|
| 1:1 | 50% |
| 1:2 | 33% |
| 1:3 | 25% |
| 2:1 | 67% |
| 3:1 | 75% |
A 1:3 trade only needs to win one time in four to break even, which is why traders who aim for large winners can be profitable while losing most of their trades. Flip it around: a 2:1 risk-reward (more risk than reward) forces you to win two out of three just to stay flat. Your real edge is the gap between the win rate you actually achieve and the breakeven win rate your ratio demands. This is the same relationship that powers expectancy.
What Counts as a Good Risk-Reward Ratio
There is no single correct ratio, and chasing a big one for its own sake backfires. Many traders treat 1:2 or better as a baseline, but a wide target you rarely reach is worse than a modest one you hit consistently. A 1:1.5 setup that wins 60% of the time beats a 1:5 setup that wins 10% of the time. The right ratio is the one your strategy can actually realize, which is why you check the reward-to-risk you planned against the R-multiple you really got.
Key Takeaways
- The risk-reward ratio compares what you risk to what you aim to make, set by your stop and target before you enter.
- It defines your breakeven win rate. A 1:3 ratio only needs a 25% win rate to break even.
- A larger ratio is not automatically better. It has to be a target your strategy actually reaches.
- Compare the ratio you planned to the realized R-multiple to see whether you let winners run or cut them short.
Common Mistakes
The most common mistake is widening the target to make the ratio look good, then never reaching it. A 1:5 plan means nothing if price reverses at 1:1 every time. The opposite error is moving your stop wider mid-trade to avoid being stopped out, which quietly worsens your real ratio and turns a planned 1:3 into a 2:1. Traders also confuse the planned risk-reward ratio with the realized result. The ratio is the plan you set before entry; the R-multiple is what you actually got. And a strong ratio on its own proves nothing until you read it next to the win rate it comes with.
How JournalX Tracks Risk-Reward
Because pre-trade planning is built into JournalX, you record your entry, stop, and target before the trade, so your intended risk-reward ratio is captured up front. After the trade closes, JournalX compares that plan to your realized R-multiple, trade by trade, so you can see whether you actually hit the targets you set or cut winners early. Slice it by setup with stackable filters and you learn which strategies justify a wide target and which ones pay you faster, then pair it with your win rate and expectancy to judge the whole edge.
Frequently asked questions
What is a good risk-reward ratio in trading?
Many traders use 1:2 or better as a rule of thumb, aiming to make at least twice what they risk. There is no universal best ratio, though. A good ratio is one your strategy can actually reach often enough, since a wide target you rarely hit is worse than a modest one you reach consistently.
What does a 1:2 risk-reward ratio mean?
A 1:2 risk-reward ratio means you are risking one unit to make two. If your stop is $100 below your entry, your target is $200 above it. At 1:2 you only need to win about a third of your trades to break even before costs.
How does risk-reward ratio affect win rate?
The ratio sets your breakeven win rate, the share of trades you must win to avoid losing money. The formula is risk divided by risk plus reward. A 1:1 ratio needs 50%, a 1:3 ratio needs only 25%, and a 2:1 ratio needs about 67%.
What is the difference between risk-reward ratio and R-multiple?
The risk-reward ratio is the plan you set before entering, how many units of reward you are targeting per unit of risk. The R-multiple is the outcome, how many units of risk you actually made or lost. You might plan a 1:3 trade and exit at +1.4R.