How Many Trades Do You Need to Judge a Strategy?
How many trades to evaluate a trading strategy? Usually 100 to 400, not 20. The sample-size math for win rate and expectancy, with a formula for your own numbers.
Most traders judge a new setup after a few weeks. Ten trades in, it feels broken. Twenty-five trades in, it feels like the answer. Both reads are mostly noise, and the reason is arithmetic, not psychology. This post works out how many trades to evaluate a trading strategy honestly, using two numbers from your own journal, and shows why the answer is usually several times bigger than people expect.
The short answer: it depends on the edge size
The number of trades you need comes from one rough rule:
Trades needed ≈ (2 × standard deviation ÷ expectancy)²
Expectancy is your average result per trade, and the standard deviation measures how far individual trades swing around that average. Measure both in R-multiples, so a 1R loss is always −1 no matter the position size. The rule tells you roughly when your measured expectancy will sit two standard errors above zero, which is about 95 percent confidence that the edge is not luck.
Here is what that gives for some common setups, each with a 1R loss:
| Setup | Win rate | Average win | Expectancy | Std. deviation | Trades needed |
|---|---|---|---|---|---|
| Runner | 35% | 3R | +0.40R | 1.91R | ~90 |
| Swing | 45% | 2R | +0.35R | 1.49R | ~75 |
| Balanced | 50% | 1.5R | +0.25R | 1.25R | ~100 |
| Scalp | 60% | 1R | +0.20R | 0.98R | ~100 |
| Thin swing | 40% | 2R | +0.20R | 1.47R | ~215 |
| Thin scalp | 55% | 1R | +0.10R | 0.99R | ~400 |
The pattern is the useful part. Halve the edge and you need four times the trades. A strategy with a big edge proves itself in under 100 trades. A strategy with a thin edge, which is what most real edges look like, takes hundreds.
Why 20 or 30 trades tell you almost nothing
Start with the number traders check first, win rate. Every win rate you measure comes with a margin of error, and on small samples that margin is huge. Using the standard confidence interval for a proportion, here is the 95 percent range around a measured 50 percent win rate:
| Trades | 95% range for a measured 50% win rate |
|---|---|
| 20 | 28% to 72% |
| 30 | 32% to 68% |
| 50 | 36% to 64% |
| 100 | 40% to 60% |
| 200 | 43% to 57% |
| 500 | 46% to 54% |
After 30 trades, a 50 percent win rate means the true number is somewhere between a strategy that loses badly and one with a strong edge. You do not know which yet. Even 100 trades leaves a 20-point window. That is why one great month on a new setup is not evidence, and neither is one bad month.
Expectancy needs even more trades than win rate
Expectancy is the number that decides your account, and a high win rate can still lose money without it. It is also harder to pin down, because it carries the swing in trade size on top of the swing in wins and losses.
Take a setup that wins 40 percent of the time, makes 2R on winners and loses 1R on losers. Its true expectancy is +0.2R per trade, a solid edge. The chart below shows the 95 percent range you would measure at different sample sizes if you traded it perfectly.
After 20 trades, the range runs from −0.44R to +0.84R. A real +0.2R edge can easily show up as a losing strategy. After 100 trades the range still dips below zero. It only clears zero past roughly 210 trades, in line with the ~215 in the table above. For the arithmetic behind these bands, worked on a real trade list, see our guide on how to calculate expectancy.
What a real edge looks like trade by trade
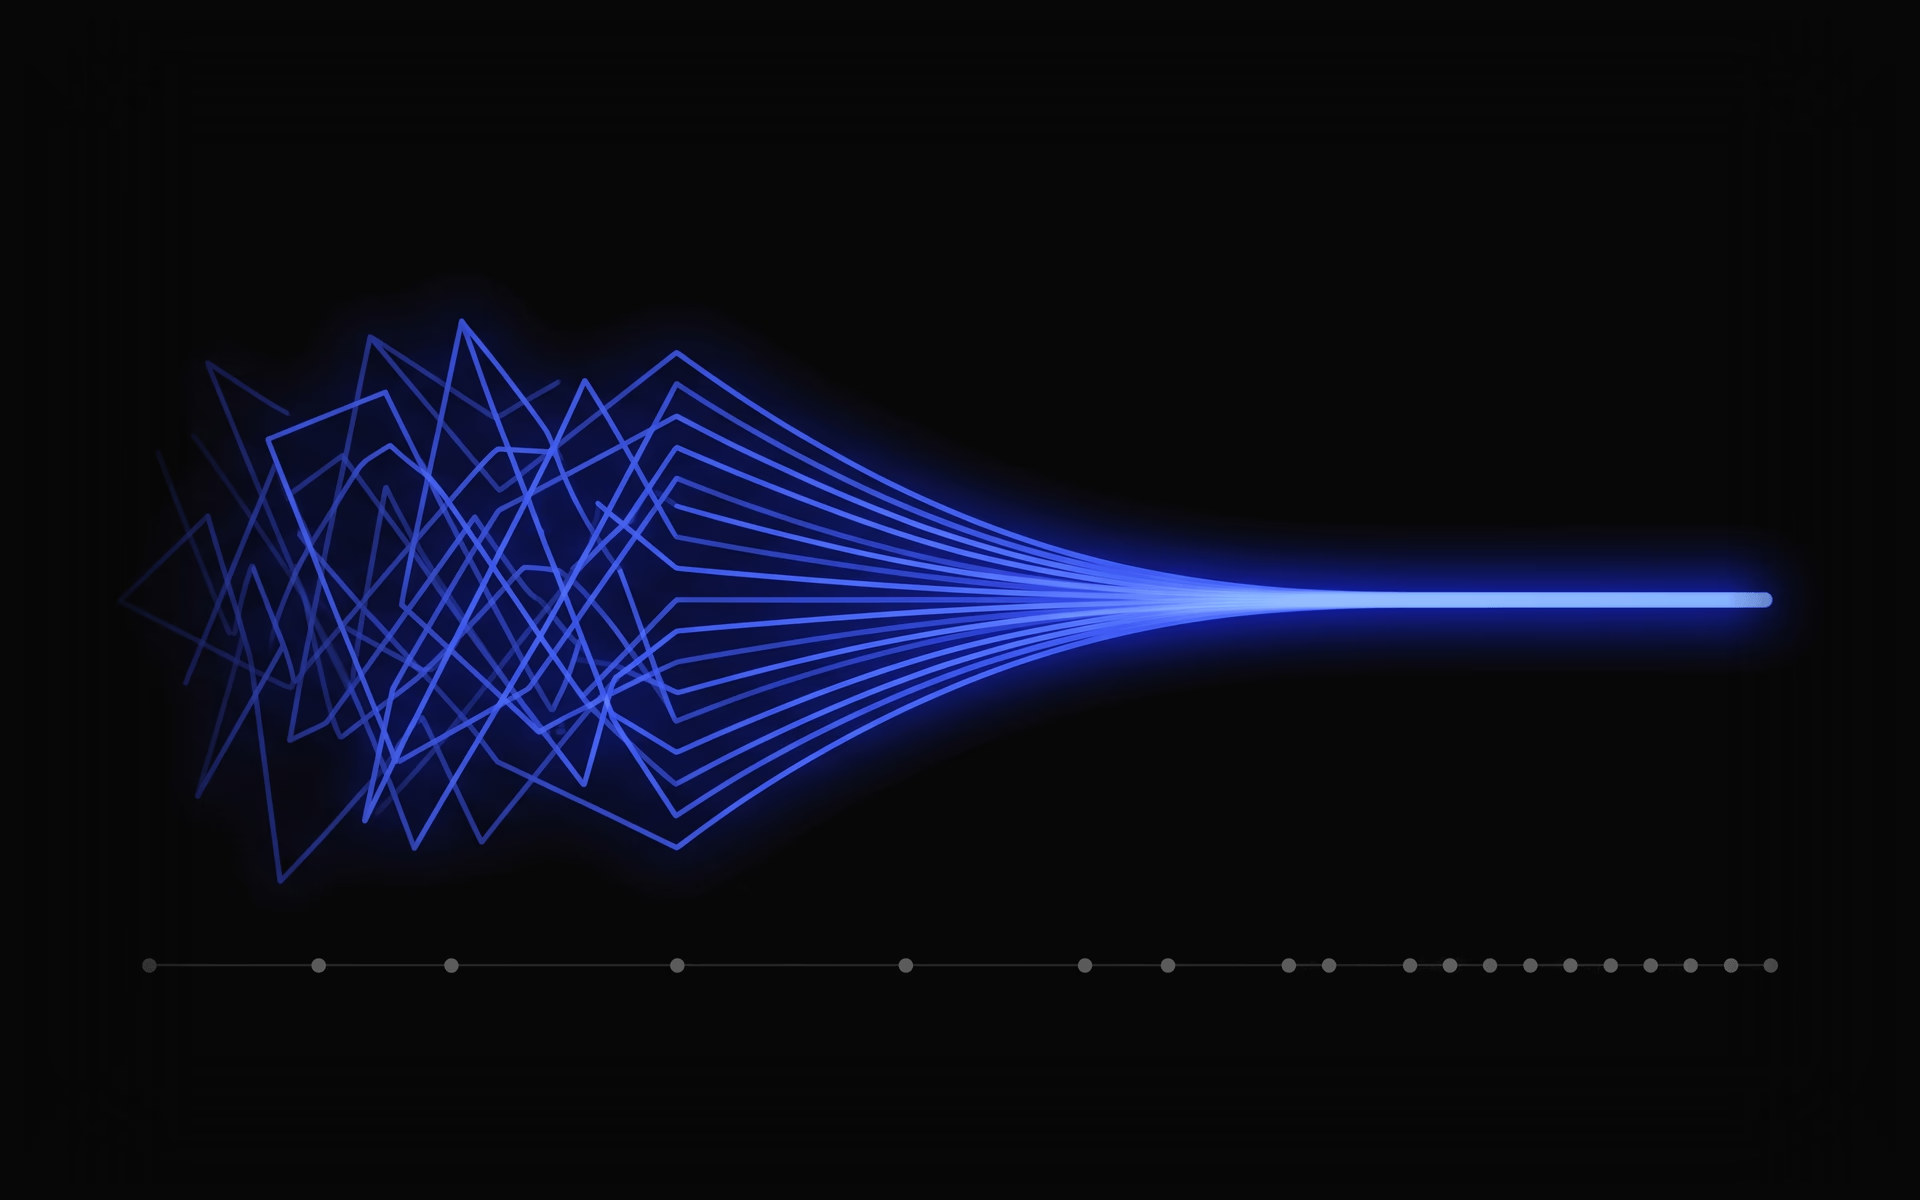
Ranges are abstract, so here is the same setup traded four times by four simulated traders. Each line is that trader's running expectancy, recalculated after every trade. All four have the same +0.2R edge underneath.
One trader was flat or underwater for much of the first 130 trades. Most people would have dropped the setup by then, and they would have dropped a real edge. Another looked brilliant early and then gave much of it back, which is the same noise pointing the other way. The funnel only gets narrow late, and that slow tightening is the part a track record has to sit through. The Sharpe ratio has the same problem at the account level: its own error band only tightens with years of data.
Three ways traders shrink their sample without noticing
You might have 300 trades in your journal and still be judging a setup on 40. These are the usual reasons.
1. Slicing. Every filter divides the sample. Three hundred trades split across four setups is 75 each, and splitting those by session leaves you near 25 again. The fields worth tracking in a trading journal become useful only once each slice has enough trades in it.
2. Testing many variations. Try 20 versions of a setup (different stops, filters, times of day) and the best one will look good partly by chance. If none of the 20 has an edge, the odds that at least one still passes a 95 percent test are about 64 percent. Statisticians call this the multiple comparisons problem, and it is the main way backtests fool people.
3. Changing the rules mid-sample. Moving your stop or adding a filter after 40 trades starts a new strategy with a new sample of zero. Write the rules down before you start counting, which is the point of a trading plan you will actually follow.
The math above also assumes each trade is independent. Two hundred trades taken in one month of one market condition carry less information than two hundred spread over a year, so count calendar time too.
How to judge a strategy before the sample is big enough
You cannot skip the sample, but you can collect it sensibly.
- Pick the number in advance. Run the formula on your expected win rate and payoff, write the number down, and do not judge the setup before you reach it.
- Size small while you collect. Keep risk per trade low enough that a long run of noise cannot hurt you. A real edge traded too large can still hit your risk of ruin before the sample confirms it.
- Cut clear losers sooner than you confirm winners. With a typical spread of about 1.4R per trade, a setup at −0.5R after 40 trades has its whole 95 percent range below zero. That is enough to stop. A setup at +0.2R after 40 trades is not enough to scale up.
- Judge execution early, results late. In the first 30 trades, ask whether you followed the rules, not whether you made money. The weekly trade review process scores process separately from P&L for exactly this reason.
- Watch drawdown alongside expectancy. A positive result you cannot sit through in real life does not help you.
Sample size is the least exciting part of trading and one of the most expensive to ignore. Most dropped strategies were never given a fair test, and most "proven" ones were only proven over a lucky stretch. Give each setup a clear sample target before you judge it, and the decision becomes math instead of mood.
See how many trades back each number
JournalX shows expectancy, win rate and profit factor per setup with the trade count next to every figure, so you can see which results rest on a real sample and which are still too thin to trust.
Frequently asked questions
Is 30 trades enough to evaluate a trading strategy?
Rarely. After 30 trades, a measured 50 percent win rate is consistent with a true win rate anywhere from about 32 to 68 percent, and an expectancy of a few tenths of an R cannot be told apart from zero. Thirty trades is enough to check that you can execute the rules and that your data is clean, not to decide whether the strategy has an edge.
How many trades do you need to backtest a strategy?
The same math applies to a backtest as to live trading, so a typical setup needs somewhere between 100 and 400 trades, more if the edge is thin. Backtests also need extra care because testing many variations and keeping the best one makes a lucky result look like a real edge.
How do I calculate how many trades I need?
Work in R. Take the standard deviation of your trade results and your expectancy per trade, then compute two times the standard deviation divided by the expectancy, and square it. A setup with a 1.5R standard deviation and a 0.25R expectancy needs about 144 trades before the result stands clearly above zero.
Can you judge a high win rate strategy with fewer trades?
Often, yes. A strategy that wins 60 percent of the time with 1R winners and 1R losers has smaller swings per trade than one that wins 40 percent of the time with 2R winners, so at the same expectancy it needs less than half as many trades to confirm. What matters is the size of the edge relative to the spread of results, not the win rate alone.
More articles
Performance & Analytics
Why a 70% Win Rate Can Still
A 70% win rate sounds unbeatable, yet it can still lose money. Here is the win rate vs expectancy math that decides your account, with worked examples.
Trading Journal
What to Track in a
What to include in a trading journal, field by field: what to log from your first trade, what only pays off after 50 trades, and what to skip.