Bullish and Bearish Engulfing Patterns
The engulfing candlestick pattern explained. Bullish and bearish rules you can measure, why location matters, what the published stats say, and how to test it.
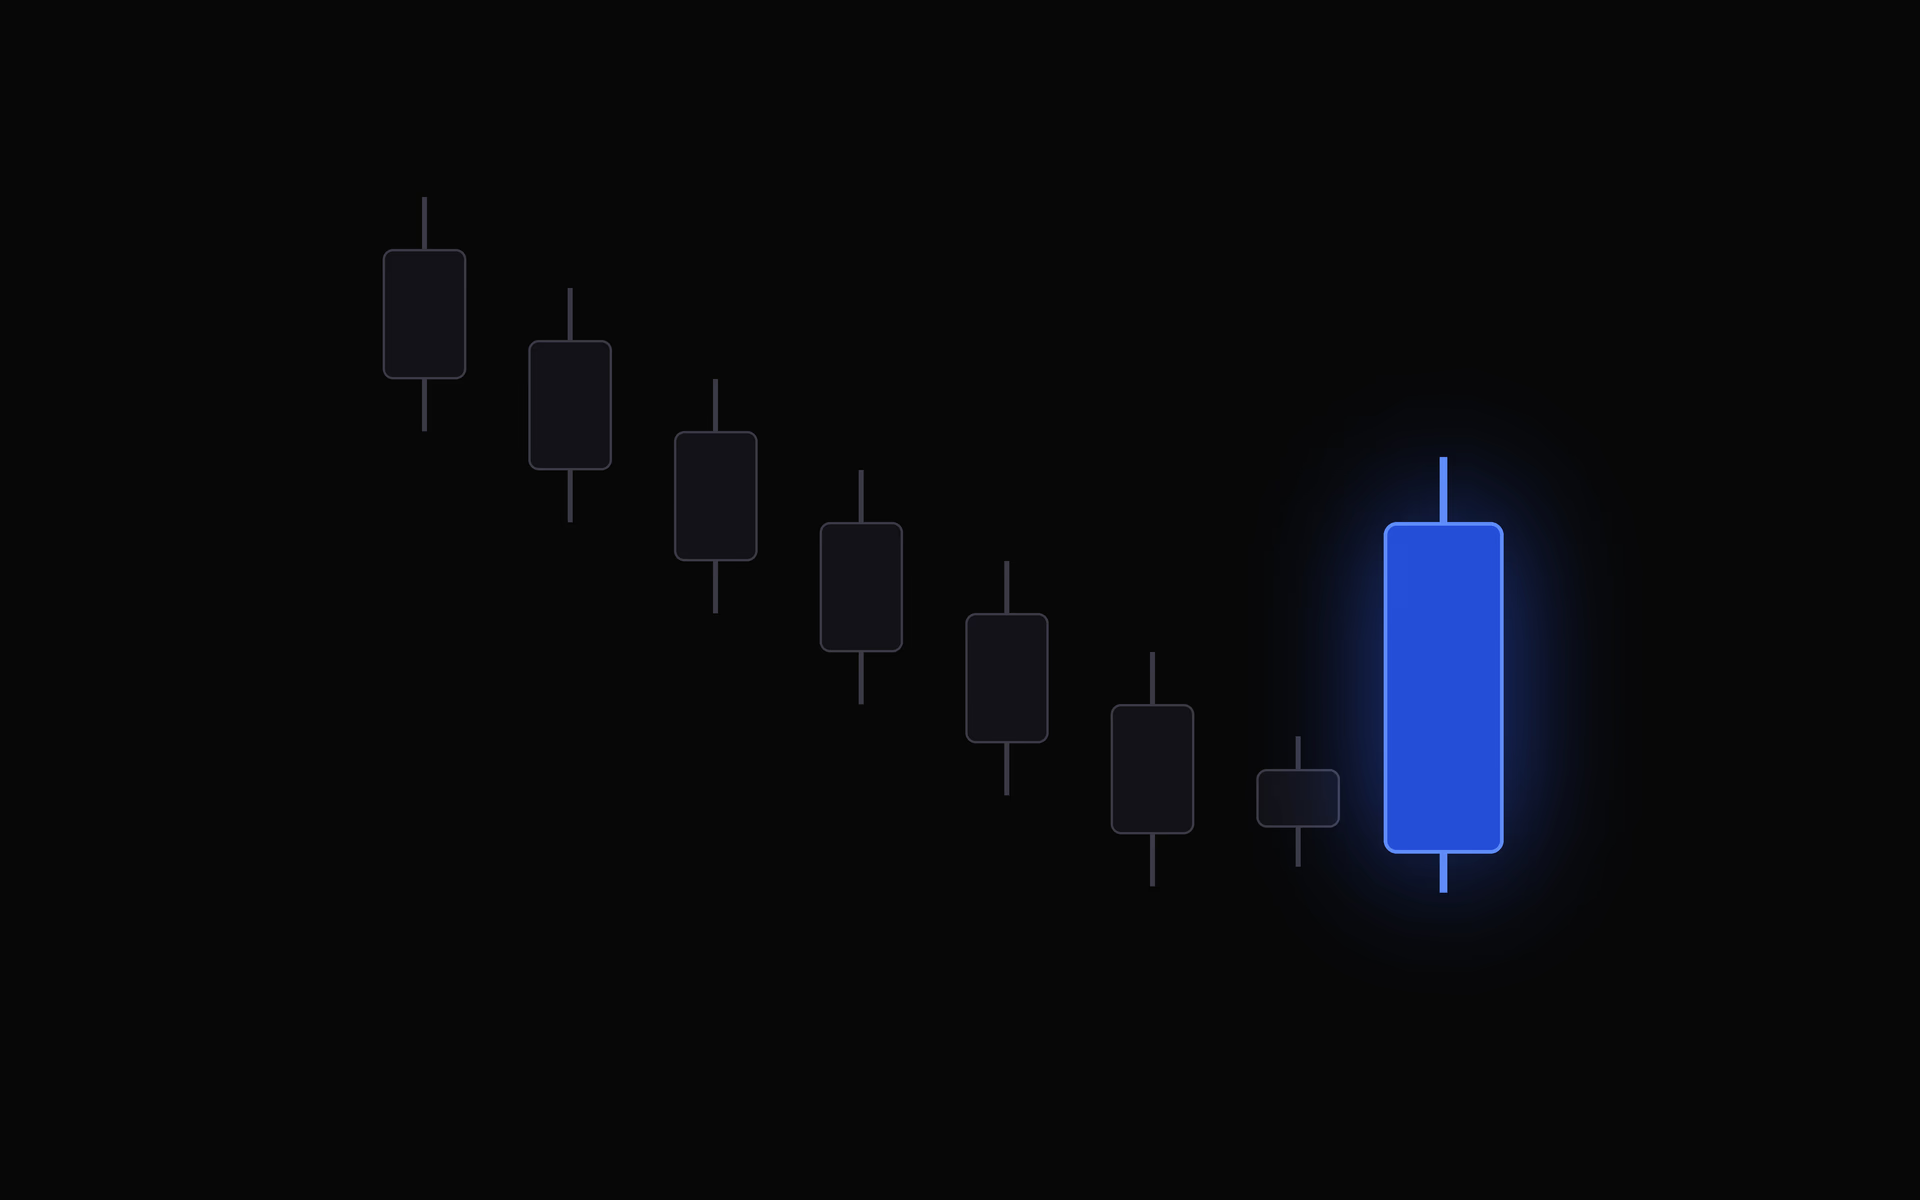
The engulfing candlestick pattern is the chart's way of showing a one-period takeover: the sellers set the tone for one candle, and the next candle erases all of it and closes beyond where the first candle began. It is one of the most frequently cited reversal patterns, and also one of the easiest to see everywhere once you start looking. This guide covers the anatomy of a bullish and bearish engulfing candle, how to define one you can measure, where it carries information, the patterns it gets confused with, what Thomas Bulkowski's research found, and how to test it on your own trades.
If you have read our guides to the hammer and the doji, the method is the same. Shape first, then location, then your own numbers.
What an engulfing candlestick pattern is
Every candlestick records the open, high, low, and close for one period. The real body is the box between the open and the close. The shadows, or wicks, reach out to the high and low.
An engulfing pattern is a two-candle arrangement. The first candle is a normal body in the direction of the current trend. The second candle opens at or beyond the first candle's close, runs the other way, and closes beyond the first candle's open. Its body swallows the first body whole.
- Bullish engulfing: forms in a downtrend. A down candle, then a larger up candle that opens at or below the down candle's close and closes above its open.
- Bearish engulfing: forms in an uptrend. An up candle, then a larger down candle that opens at or above the up candle's close and closes below its open.
Bulkowski's identification guidelines for both versions are short: two candles, a trend leading into them, the second body overlapping the first, and "shadows are unimportant." The body comparison is the whole pattern.
What an engulfing candle is telling you
Read the two candles as a short story. During the first period the trend carried on as usual. During the second, price started where the trend left it, and then the other side took over so completely that the close landed past the first candle's starting point.
That is a bigger statement than a doji, which only shows a tie. An engulfing candle shows one side winning a full period outright, against the direction of the move. After ten sessions of selling, a session where buyers recover everything the previous session lost, and more, is a real change in behavior.
It is still one period. A takeover that lasts a single candle can be a short squeeze, a reaction to news, or a quick rebalancing before the trend resumes. The engulfing candle tells you the balance shifted. It does not tell you the shift will hold.
How to define an engulfing pattern you can measure
"The second body covers the first" sounds precise until you try to apply it to a few hundred charts. Four questions decide what you are actually counting.
| Question | A measurable answer | Why it matters |
|---|---|---|
| Is there a trend to reverse? | At least five candles of lower closes, or price below a moving average you name | Without a prior move, it is a two-candle wiggle, not a reversal |
| Is the first candle a real body? | First body at least 30% of its own range | If the first candle is a doji, almost any candle engulfs it |
| Is the second body big enough? | Second body at least 1.5 times the first, or at least one average true range | Separates a decisive candle from one that barely covers a small body |
| What about equal prices? | Allow the second open to equal the first close | Needed in forex, crypto, and any market that rarely gaps |
The second row is the one most people miss. A tiny first candle makes the engulfing test trivial: nearly any ordinary candle will cover a body that is a few ticks tall. Those patterns look identical on a chart and carry far less information, because nothing much was overturned.
The last row matters if you trade around-the-clock markets. In forex and crypto, each candle usually opens at the previous close, so a rule that the second candle must open strictly beyond the first close would almost never fire. Allowing equality is standard. On stocks and futures, where overnight gaps are common, you can keep the strict version if you prefer.
Location decides what an engulfing pattern means
The same two candles carry very different weight depending on where they form.
After an extended move into a level price has turned at before. This is where the pattern earns attention. The move gives the engulfing candle something to overturn, and the level gives other traders a reason to be watching. A slide into a prior swing low followed by a bullish engulfing candle is a change in behavior at a meaningful price.
In the middle of a sideways range. Ranges produce engulfing candles constantly, because price swings back and forth with no trend to reverse. A bullish engulfing pattern halfway up a range is often just the next swing.
As a pullback inside a larger trend. This is the location Bulkowski's research favors. His trading tips for the bullish engulfing pattern say to "trade bullish engulfing candlesticks when the primary trend is upward" and to look for a downward retrace within a rising trend. For the bearish version, the matching tip is to "trade upward retracements in a downward price trend." In other words, the pattern did best when it marked the end of a pullback against the bigger trend, not when it tried to reverse the bigger trend itself.
That last point surprises people. The textbook picture is an engulfing candle turning a long trend around. The data says the pattern was more useful as a sign that a counter-trend pullback had run out.
The patterns an engulfing candle gets confused with
Several two- and three-candle patterns share parts of the engulfing shape. Mixing them up changes what you are measuring.
| Pattern | Shape | How it differs |
|---|---|---|
| Piercing line / dark cloud cover | Second candle closes past the midpoint of the first body, but not past its open | A partial takeover. The engulfing candle is the complete version |
| Outside bar (outside day) | Second candle's full range, wicks included, covers the first candle's range | Compares the ranges, not the bodies. Color may not matter |
| Harami | A small second body sits inside a larger first body | The reverse arrangement. The second candle is the small one |
| Three outside up / down | An engulfing pattern plus a third candle that closes further in the new direction | Includes confirmation in the definition |
The last row is the one to keep in mind. Bulkowski's tests put three outside up, which is a bullish engulfing pattern followed by a higher close, at a bullish reversal rate of 75 percent and an overall rank of 34 out of 103. The bullish engulfing pattern on its own ranks 84th. Much of the difference comes from the third candle, which is the confirmation many traders wait for anyway.
How reliable is the engulfing pattern?
Bulkowski's statistics, published on his site and in the Encyclopedia of Candlestick Charts, are the most quoted numbers on this pattern. Ranks are out of 103 candle types, and lower is better.
| Pattern | Tested result | Overall performance rank | Frequency rank |
|---|---|---|---|
| Bullish engulfing | Bullish reversal 63% of the time | 84 | 12 |
| Bearish engulfing | Bearish reversal 79% of the time | 91 | 11 |
| Three outside up | Bullish reversal 75% of the time | 34 | 24 |
| Three outside down | Bearish reversal 69% of the time | 39 | 21 |
The reversal rate and the performance rank measure different things, and that is the most useful lesson in the table. The reversal rate is how often price broke out of the pattern in the reversal direction. The performance rank reflects how far price traveled afterward. The bearish engulfing pattern has one of the higher reversal rates in the catalog and one of the worst performance ranks, and Bulkowski describes the trend after the breakout as "short-lived." The turn happens often. The move after it is small.
Both engulfing patterns also rank 11th and 12th for how often they appear. Common, frequently right on direction, and weak on follow-through is a profile that can feel productive while doing little for your expectancy, because a high hit rate on small moves still has to cover the losers and the costs.
Bulkowski's tips point to where better results hide: choose tall candles, prefer patterns within a third of the yearly low, and trade them as the end of a pullback in the direction of the primary trend. As with any published statistic, these numbers came from particular markets, a particular period, and a particular definition. Treat them as a starting hypothesis, not a result you inherit.
The structure an engulfing pattern gives you
An engulfing pattern hands you clean reference levels, which is a large part of its appeal.
- The far end of the pattern is the invalidation point. For a bullish engulfing pattern that is the lower of the two lows. A trade back below it means the takeover failed.
- The distance from entry to that level is one unit of risk, or 1R, and every outcome can be measured as a multiple of it.
- The next obvious level is the natural first target, such as the last swing high before the decline.
Here is the catch, and it is specific to this pattern. The engulfing candle is large by definition, so entering at its close puts the entry far from the stop. Take a $50 stock where the pattern's low is $49.70, the stop sits at $49.65, and the prior swing high is $52.20.
| Engulfing candle closes at | Risk to the stop | Reward to $52.20 | Reward-to-risk |
|---|---|---|---|
| $50.70 | $1.05 | $1.50 | 1.4R |
| $51.60 (a very tall candle) | $1.95 | $0.60 | 0.3R |
The taller candle looks more convincing and is the kind Bulkowski's tips favor, yet entering at its close leaves almost nothing between the entry and the target. Some traders handle this by waiting for a pullback into the engulfing body, for example a limit order near the body's midpoint, which shrinks the risk unit but means some of the strongest patterns never fill. That trade-off between a better price and missed winners is exactly what your records can measure. How to set a stop-loss covers adding a buffer beyond the low and checking the stop against average true range.
How to test the engulfing pattern on your own trades
Whether the pattern works for you depends on your market, timeframe, definition, and what you do after the entry. All of that can be tested with the same process you would use for any setup.
Step 1: Write the definition down
Use the four rules from the definition table, with your own numbers. For example: five lower closes before the pattern, first body at least 30 percent of its range, second body at least 1.5 times the first, equal open allowed. Write it before the first trade so the rule cannot bend toward the result you wanted.
Step 2: Decide the trade rules
Entry at the engulfing close, on a pullback into the body, or after a confirming third candle? Stop below the pattern low, or below the prior swing? Target at the next level, or a fixed multiple of risk? Two traders using the same pattern with different rules are testing different setups.
Step 3: Tag every engulfing trade the same way
One setup tag, spelled identically every time, plus bullish or bearish as its own field. How to tag trades covers keeping the vocabulary small and consistent enough to filter on.
Step 4: Record the context as fields
Trend before the pattern, at a level or not, with or against the larger trend, second body as a multiple of the first, entry type, and timeframe. As separate fields, each one is a variable you can split by later. In a free-text note, none of them are.
Step 5: Wait for a real sample
Ten trades say almost nothing. The error band on a win rate measured over 25 trades is close to plus or minus 20 percentage points, as the sample size entry shows. A few dozen trades on one variant is where the numbers begin to mean something.
Step 6: Read the results as a group, then split once
Start with expectancy in R. Then read win rate next to average win and average loss, since a pattern that is often right on direction but weak on follow-through shows up as a decent win rate with small winners. Then profit factor. After that, split by one variable at a time, chosen in advance: with the larger trend against counter-trend, entry at the close against entry on a pullback, at a level against not. Slicing forty trades twenty ways will always turn up one brilliant-looking cut by chance.
A weekly trade review is the natural place to run this, since you are already grouping trades by setup there.
Common mistakes
- Counting a doji as the first candle. When the first body is tiny, almost anything engulfs it, and the sample fills with patterns that overturned nothing.
- Ignoring the trend in front. An engulfing candle in a choppy range is just the next swing.
- Reading a high reversal rate as a good trade. The bearish engulfing pattern reverses often and travels little. Direction is only half the result.
- Entering a very tall engulfing candle at its close without checking the target. The stop is far away, and the next level may be close.
- Fighting the larger trend by default. The published data favored engulfing patterns that ended a pullback, not ones that tried to turn the main trend.
- Changing the definition after a loss. Deciding a losing trade "wasn't really engulfing" makes your own records useless.
Putting it together
The engulfing candlestick pattern shows something real: one side took over a full period and erased the previous one. Whether that takeover leads anywhere depends on what surrounds it, the move in front, the level it formed at, the direction of the larger trend, and the room left between your entry and the next level.
The published numbers say the pattern is often right about direction and weak about distance, so don't take any rate on faith, including the ones quoted here. Define the pattern with numbers, tag it the same way every time, gather a real sample, and read expectancy next to your average win and average loss. Your own trades are the only test that settles whether it belongs in your process.
See how each setup performs for you
JournalX tags every trade by setup and computes expectancy, win rate, and profit factor for each one, so you can see what the engulfing pattern does on your charts instead of guessing.
Frequently asked questions
What is the difference between a bullish and a bearish engulfing pattern?
They are mirror images. A bullish engulfing pattern forms after a decline, when a down candle is followed by a larger up candle whose body covers the first candle's body. A bearish engulfing pattern forms after a rally, when an up candle is followed by a larger down candle whose body covers the first one. The trend in front of the pattern is part of the definition.
Do the shadows have to be engulfed too?
No. The standard definition only compares the real bodies, and Thomas Bulkowski's guidelines say to ignore the shadows. A second candle whose full range, wicks included, covers the first candle's range is usually called an outside bar or outside day. Some traders require that stricter version. Pick one rule and use it every time.
How reliable is the engulfing candlestick pattern?
In Bulkowski's tests the bullish engulfing pattern broke out in the reversal direction 63 percent of the time and the bearish engulfing 79 percent of the time, but both ranked in the bottom fifth of 103 candle types for overall performance (84th and 91st). The turn shows up often, and the move after it tends to be small.
Is an engulfing candle the same in forex and crypto?
The idea is the same, but markets that trade around the clock rarely gap, so each candle usually opens at the previous close. A strict rule that the second candle must open beyond the first candle's close would almost never trigger there. Most traders allow the second open to equal the first close in those markets.
Where do you put a stop on an engulfing pattern?
The common reference is just beyond the far end of the pattern, below the low of a bullish engulfing pattern or above the high of a bearish one, because a trade back through that level means the reversal failed. Because the engulfing candle is large by definition, that stop is often far from the entry, so check the reward-to-risk before taking the trade.