The Doji Candlestick Pattern
A doji candlestick shows buyers and sellers ending a period level. How to define one you can measure, the four types, why location matters, and how to test it.
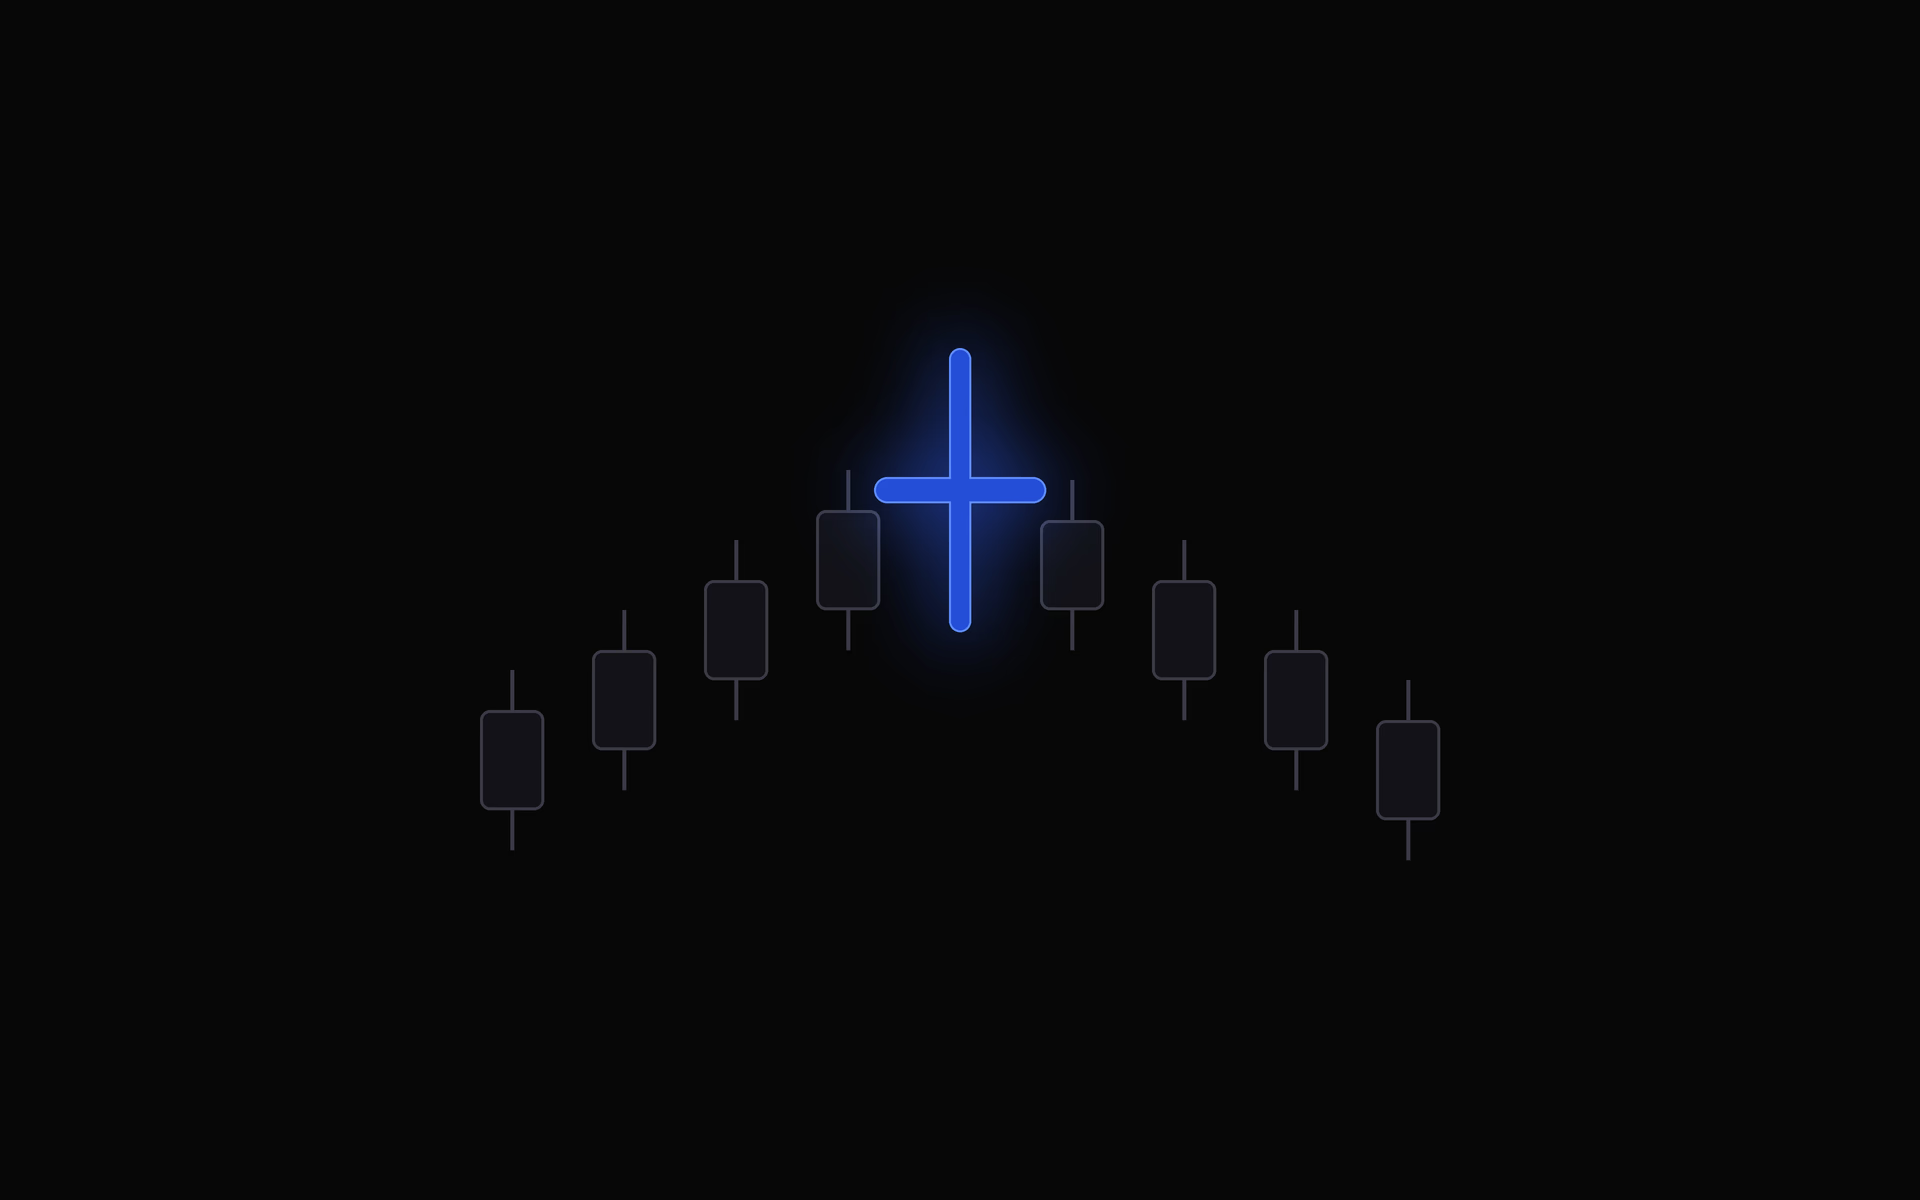
The doji candlestick pattern is the purest record of indecision a chart can show: price moved during the period and then closed right where it opened. It is also one of the most common candles you will see, which is exactly why so many traders over-read it. This guide covers the anatomy, how to define a doji precisely enough to measure, the four types, where a doji carries information and where it carries none, the candles it gets confused with, what the published research says, and how to find out whether the pattern does anything for you.
If you have read our hammer candlestick guide or the guide to the engulfing candlestick pattern, the approach will be familiar. Shape first, then location, then your own numbers.
What a doji candlestick is
Every candlestick records four prices for one period: the open, the high, the low, and the close. The real body is the rectangle between the open and the close. The shadows, also called wicks, run out to the high and the low.
A doji is the arrangement where the body almost disappears. The open and the close land so close together that the body is drawn as a thin horizontal line, and what is left is the range. Price traveled somewhere during the period, up, down, or both, and by the close every bit of that move had been given back.
The name is Japanese, and it points at the one thing that defines the candle: the open and the close match. That is the whole definition. A doji says nothing about which side is stronger, only that by the end of the period neither side had pulled away.
How small is "small"? Defining a doji you can measure
Bulkowski, who catalogued candle statistics across thousands of charts, describes a doji as a candle with the opening and closing prices "within a few pennies of each other." That works for a $20 stock. It does not work for a $900 stock, a futures contract, or a currency pair, where a few pennies is either everything or nothing.
The fix is to measure the body against the candle's own range instead of in price units:
| Rule | What it means | Effect on your sample |
|---|---|---|
| Body ≤ 5% of the range | Open and close nearly identical | Strict. Fewer dojis, cleaner ones |
| Body ≤ 10% of the range | A thin but visible body allowed | The most common practical rule |
| Body ≤ 25% of the range | Includes small-bodied candles | Too loose. You are now counting spinning tops |
A ratio works on any market and any timeframe, because it describes the candle's shape rather than its price. Pick a number, write it down, and use it every time. A candle with a body of 8 percent of the range is a doji under a 10 percent rule and is not one under a 5 percent rule, and if you switch between the two depending on the chart, your results will measure your mood instead of the pattern.
There is a second filter worth adding: the size of the whole candle. A doji with a range far smaller than the candles around it is often just a quiet period, like a lunch-hour bar or a holiday session. Comparing the candle's range to the average range of recent candles, for example the 14-period average true range covered in how to set a stop-loss, tells you whether the tie happened during a real fight or during a nap.
The four types of doji
All dojis share the same thin body. What separates them is where that body sits inside the range, which tells you where the period's fighting happened.
| Type | Shape | What happened during the period |
|---|---|---|
| Standard doji | Thin body, short shadows on both sides | A narrow, quiet period that closed flat |
| Long-legged doji | Thin body near the middle, long shadows on both sides | Price swung hard both ways and settled where it started |
| Dragonfly doji | Thin body at the high, long lower shadow, no upper shadow | Sellers pushed price down and buyers took all of it back |
| Gravestone doji | Thin body at the low, long upper shadow, no lower shadow | Buyers pushed price up and sellers took all of it back |
The dragonfly is the extreme version of a hammer: the same long lower shadow, with no body left at all. The gravestone is the extreme version of a shooting star. The long-legged doji is the most dramatic of the four, and the one most likely to tempt you into a trade with a stop that is far too wide, which comes up again below.
What a doji is actually telling you
Read a doji as a short story about one period. Price moved away from the open, and by the close it was back. Whatever pressure pushed it away ran out, or met equal pressure from the other side.
That is genuinely useful information when it shows up at the right moment. If a market has rallied for ten straight sessions with closes near the highs, a session that closes flat says the buying that drove every prior close did not show up this time. The doji is a change in behavior, and a change in behavior is worth noticing.
The same candle in a market that has been drifting sideways for a week tells you nothing new. Flat closes are what drifting markets produce. A doji there is the market doing exactly what it was already doing.
So a doji is not a prediction. It is evidence that the balance between buyers and sellers was even for one period, and the question that matters is whether that balance is a change from what came before.
Location decides what a doji means
The same candle carries very different amounts of information depending on where it forms.
After an extended move, at a level price has turned at before. This is where a doji earns attention. The move gives the doji something to interrupt, and the level gives other traders a reason to be watching the same price. A run up into a prior swing high, or a slide down into the bottom of a well-tested range, followed by a flat close, is a real change in behavior at a meaningful spot.
In the middle of a sideways range. Ranges produce dojis by the dozen, because price has no directional pressure to interrupt. Bulkowski's own trading tips for the gravestone doji include "ignore gravestone doji in congestion areas," and that advice fits every type. These are the dojis that pad a sample with noise.
Partway through a steady trend. Trends pause. A single flat close in a market making higher highs and higher lows is often a rest before the next leg, not a turn. Bulkowski's tests on the northern doji, a doji that forms in an uptrend, found it acted as a bullish continuation 51 percent of the time, in other words the trend carried on about as often as it reversed. Treat a doji here as a reason to watch the next few candles, not as a reason to fade the trend.
The useful habit is to stop asking "is that a doji?" and start asking "what was the market doing before this doji, and is this a change?"
The candles a doji gets confused with
Several candles share the doji's small body or its long shadows, and mixing them up changes what you are measuring.
| Candle | Shape | How it differs from a doji |
|---|---|---|
| Spinning top | Small but visible body, shadows on both sides | The body is larger, often up to a third of the range. Less extreme indecision |
| Hammer / hanging man | Small body near the top, long lower shadow | Has a real body. The dragonfly doji is its body-less extreme |
| Shooting star / inverted hammer | Small body near the bottom, long upper shadow | Has a real body. The gravestone doji is its body-less extreme |
| Doji star | A doji that gaps away from a long candle before it | A two-candle setup. The gap is part of the definition |
| Morning or evening doji star | Long candle, doji star, then a long candle the other way | A three-candle pattern that includes its own confirmation |
The last row matters most. Bulkowski's tests put the morning doji star, a three-candle pattern built around a doji, at a bullish reversal rate of 76 percent and an overall performance rank of 25 out of 103 candle types. The single doji types rank far lower. Much of that difference comes from the third candle, which is confirmation baked into the pattern's definition. That is a strong hint about where the doji's information actually lives.
Confirmation, and what it costs you
An unconfirmed doji is a question. Buyers and sellers tied for one period. Nothing says who wins the next one.
The usual confirmation is to wait for the next candle to close beyond the doji's range: above its high for a bullish read, below its low for a bearish one. That turns "the move paused" into "the move paused and then reversed." Some traders also want the confirming candle to arrive on above-average volume, or to close beyond a nearby level.
Confirmation has a price. Waiting means your entry is now a full candle away from the doji, while the invalidation level, the other end of the doji, stays exactly where it was. The distance from entry to stop grows, which lowers the risk-reward ratio on the same target. You are trading a better hit rate for a smaller payoff per winner. Whether that is a good exchange depends on the sizes involved, and only your own records can answer that.
The structure a doji gives you
A doji's appeal as a setup is that it hands you two clean reference levels.
- The high and low are the triggers. A close beyond one of them is the confirmation described above.
- The opposite end is the invalidation point. Take a bullish read on a break of the high, and a trade back below the doji's low means the idea has failed.
- The distance from entry to invalidation is one unit of risk, or 1R. Every outcome can then be measured as a multiple of that distance.
Here is the catch. The long-legged doji, the most dramatic-looking of the four, has the widest range by definition. On a $50 stock, a compact doji with a $0.60 range gives you a $0.60 risk unit. A long-legged doji with a $2.80 range gives you $2.80. Against the same $3.00 target, the first trade is worth 5R and the second barely more than 1R. The candle that looks like the biggest battle often offers the worst trade.
How reliable is the doji candlestick pattern?
Bulkowski's tests, published on his site and in the Encyclopedia of Candlestick Charts, give the clearest public numbers on the single-candle doji types. Lower ranks are better, out of 103 candle types.
| Doji type | Tested result | Overall performance rank |
|---|---|---|
| Dragonfly doji | Reversal 50% of the time | 98 |
| Gravestone doji | Bearish reversal 51% of the time | 77 |
| Southern doji (in a downtrend) | Bullish reversal 52% of the time | 78 |
| Northern doji (in an uptrend) | Bullish continuation 51% of the time | 83 |
Read together, these say something plain: on its own, a doji is close to a coin flip on direction, and the moves that follow are below average. The northern and southern doji also rank 6th and 8th of 103 for how often they appear. The pattern is common and, without context, weak. Common and weak is exactly how a setup quietly drags down a trader's expectancy while feeling active and productive.
The same research also points to where the better results hide. Bulkowski's tips for several doji types say they perform best "within a third of the yearly low," taller-than-median gravestones were followed by moves about 50 percent farther than shorter ones, and the three-candle morning doji star far outperforms the lone candle. Location, size, and confirmation carry the information. The doji marks the spot.
As with any published statistic, these numbers came from particular markets, a particular period, and a particular definition. Treat them as a starting hypothesis, not as a result you inherit.
How to test the doji on your own trades
Whether the doji works for you depends on your market, your timeframe, your definition, and what you do after you enter. All of those can be tested. The process is the same one you would use for any setup.
Step 1: Write the definition down
Body no more than 10 percent of the range. Range at least equal to the 14-period average range. Preceded by at least five candles moving in one direction, ending at a prior swing high or low. Your numbers can differ. What matters is that they exist before the first trade, so the rule cannot bend toward the result you wanted.
Step 2: Decide what you will do after the doji
Confirmed only, or entry at the doji's close? Stop beyond the far end of the doji, or beyond the prior swing? Target at a fixed multiple of risk, or at the next level? A doji is not a trade until those choices are made, and two traders using the same candle with different rules are testing different setups.
Step 3: Tag every doji trade the same way
One setup tag, spelled identically every time, plus the type (standard, long-legged, dragonfly, gravestone) as its own field. How to tag trades covers keeping a small vocabulary that stays consistent enough to filter on later.
Step 4: Record the context as fields, not prose
Trend before the doji, at a level or not, confirmed or not, range compared with average range, timeframe. Written as separate fields, each one is a variable you can split by later. Buried in a note, none of them are.
Step 5: Wait for a real sample
Ten doji trades tell you almost nothing. The error band on a win rate measured over 25 trades is close to plus or minus 20 percentage points, as the sample size entry shows. A few dozen trades on one variant is where the numbers start to mean something.
Step 6: Read the results as a group, then split once
Start with expectancy in R. Then win rate next to average win and average loss, since a pattern near 50 percent lives or dies on the size of its winners. Then profit factor. After that, split by one variable at a time: at a level against not at a level, confirmed against unconfirmed, compact against long-legged. Decide those two or three splits before you look, because slicing forty trades twenty ways will always produce one brilliant-looking cut by chance.
A weekly trade review is the natural place to run this, since you are already grouping trades by setup there.
Common mistakes
- Calling every small-bodied candle a doji. Without a ratio, spinning tops and quiet bars slip into the sample and blur the result.
- Reading a doji as a reversal by itself. It records a pause. The candles after it decide whether the pause became a turn.
- Ignoring where it formed. A doji in a choppy range is ordinary. A doji after a long run into a known level is a change. They are not the same setup.
- Using a long-legged doji's full range as the stop without checking the payoff. The wider the candle, the fewer R the same target is worth.
- Trading dojis on very low timeframes. One-minute charts produce flat closes constantly. Frequency is not opportunity.
- Changing the definition after a loss. Deciding a losing trade "wasn't really a doji" makes your own records useless.
Putting it together
The doji candlestick pattern is easy to spot and easy to over-trust. The shape only says that buyers and sellers ended the period level. The value is in what surrounds it: a move strong enough for a tie to be news, a level that other traders are watching, and a next candle that confirms the change or does not. Get those right, and a doji gives you a defined idea with clear reference levels.
The published numbers say the lone candle is close to a coin flip, so don't take any win rate on faith, including the ones quoted here. Define the doji as a ratio, tag it the same way every time, gather a real sample, and read expectancy next to your average win and average loss. Your own trades are the only test that settles whether it belongs in your process.
See how each setup performs for you
JournalX tags every trade by setup and computes expectancy, win rate, and profit factor for each one, so you can see what the doji does on your charts instead of guessing.
Frequently asked questions
Is a doji candlestick bullish or bearish?
Neither, on its own. A doji only records that the open and close finished at almost the same price. After a long decline it can be read as a possible bullish turn, after a long rally as a possible bearish one, and in a sideways range it usually means very little. The trend and the level around it decide the read.
How small does the body have to be for a candle to count as a doji?
There is no official cutoff. Thomas Bulkowski describes the open and close as within pennies of each other. A practical rule is a body no larger than 5 to 10 percent of the candle's total high-to-low range. Pick one number, write it down, and use it the same way on every chart so your results stay comparable.
What is the difference between a doji and a spinning top?
Both have small bodies with shadows on each side. A doji's body is so small that the open and close are nearly equal, often drawn as a single horizontal line. A spinning top has a visible body, usually up to about a third of the range. The doji is the more extreme record of a tie between buyers and sellers.
How reliable is the doji candlestick pattern?
On its own, not very. Bulkowski's tests put the single-candle doji variants close to a coin flip, with the dragonfly doji reversing 50 percent of the time, the gravestone 51 percent and the southern doji 52 percent, and all of them ranked in the bottom third of 103 candle types for overall performance. Context and confirmation do most of the work.
Do you need confirmation after a doji?
Most traders wait for the next candle to close beyond the doji's high or low before treating it as a signal of direction, because the doji itself only shows a pause. Waiting filters out some false starts but moves the entry further from the invalidation level, which lowers the reward-to-risk on the same target.