Profit Factor vs Expectancy: Which One Tells You More?
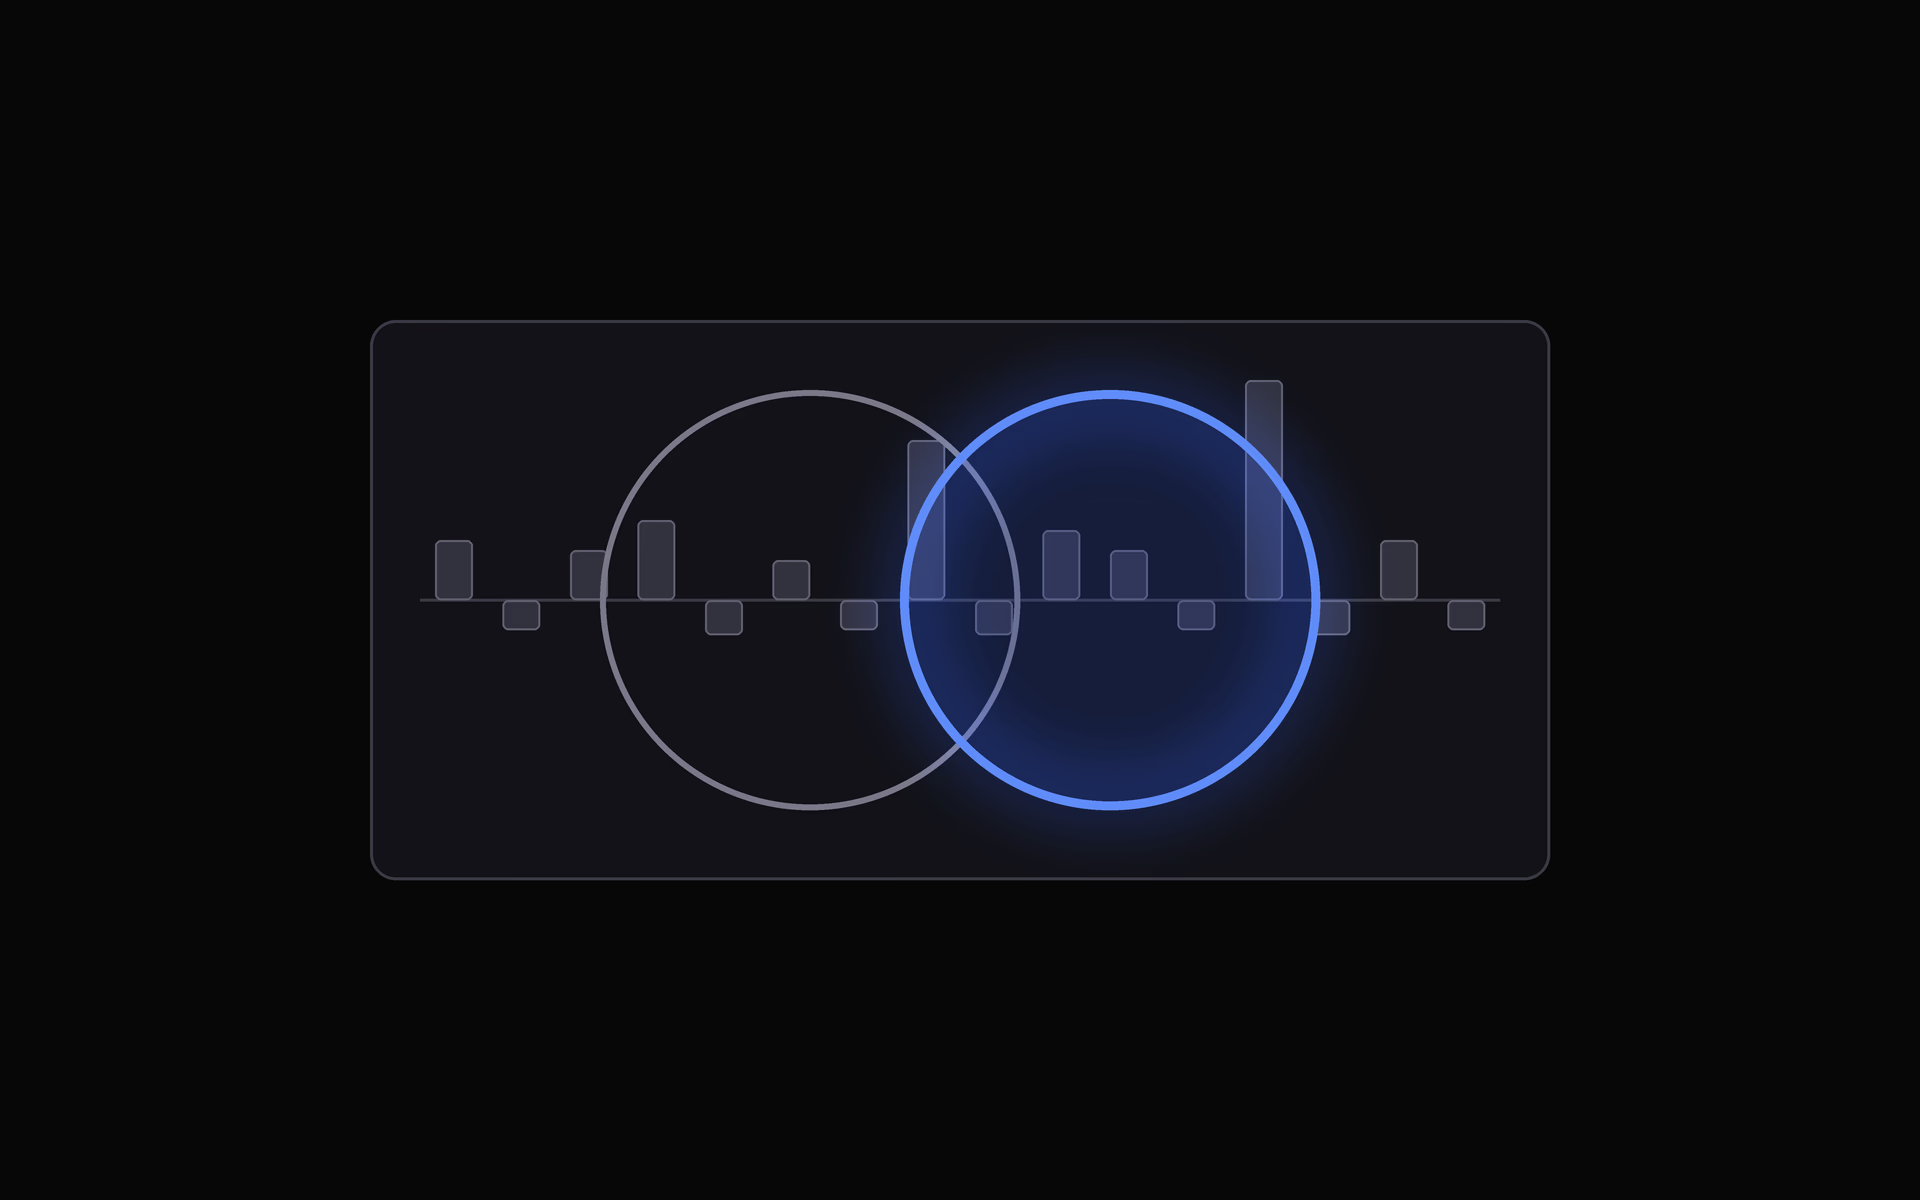
Profit factor vs expectancy: both come from the same trades, yet they can rank your setups in opposite order. Here is why they disagree and which to trust.
Profit factor vs expectancy is a question most traders never ask, because the two numbers usually move together. Both come from the same trades. Both say a strategy is profitable at the same moment. Then one day your journal shows a setup with a profit factor of 3.0 that earns less per trade than a setup sitting at 1.9, and it is not obvious which number to believe. This post works through the math behind each one, the three situations where they disagree, and which one deserves the final word.
Two formulas built from the same two totals
Every closed trade is either a win or a loss. Add up all the winners and you get gross profit. Add up all the losers, as a positive number, and you get gross loss. Both metrics are built from those two totals.
- Profit factor = gross profit ÷ gross loss. It is a ratio with no units.
- Expectancy = (gross profit − gross loss) ÷ number of trades. It is the average result per trade, in dollars or in R-multiples.
MetaTrader's strategy tester reports both side by side, defining profit factor as "the ratio of the gross profit to the gross loss" and expected payoff as "the average return of one deal" (MetaTrader 5 help). Expected payoff is expectancy under another name.
Because both use the same two totals, they can never disagree on the sign. If gross profit is bigger than gross loss, profit factor is above 1.0 and expectancy is above zero. If not, both fail together. The link between them is one line of algebra:
Expectancy = loss rate × average loss × (profit factor − 1)
So a profit factor of 1.5 with a 40% loss rate and a 1R average loss works out to 0.4 × 1 × 0.5 = 0.2R per trade. Profit factor alone can't give you that number, because it has lost the size of the trades.
When profit factor and expectancy disagree
Here are two setups from the same journal, 100 trades each, all measured in R.
| Setup A | Setup B | |
|---|---|---|
| Win rate | 60% | 35% |
| Average win | 0.8R | 3.5R |
| Average loss | 0.4R | 1.0R |
| Gross profit | 48R | 122.5R |
| Gross loss | 16R | 65R |
| Profit factor | 3.00 | 1.88 |
| Expectancy | 0.32R | 0.58R |
Setup A takes modest wins and cuts most losers well before the stop, so its average loss is only 0.4R. Setup B takes the full 1R loss often and pays for it with large winners. Profit factor ranks A far ahead. Expectancy ranks B almost twice as high. After 100 trades, B has made 57.5R and A has made 32R.
The reason is the difference between a ratio and a gap. Winning $3 for every $1 lost is a profit factor of 3.0 and a gap of $2. Winning $300 for every $150 lost is a profit factor of 2.0 and a gap of $150. Profit factor scores how lopsided the wins are relative to the losses. Expectancy scores how much is left over per trade. A setup with tiny losses can post a spectacular ratio on a thin edge.
Costs hit the high profit factor setup harder
Now charge both setups 0.1R per trade for commissions and slippage. Every win shrinks by 0.1R and every loss grows by 0.1R.
| Setup A | Setup B | |
|---|---|---|
| Profit factor, before → after | 3.00 → 2.10 | 1.88 → 1.66 |
| Expectancy, before → after | 0.32R → 0.22R | 0.58R → 0.48R |
| Share of the edge lost | 31% | 17% |
Both lose exactly 0.1R of expectancy, but that is almost a third of A's edge and only a sixth of B's. Setup A's high profit factor looked like a wide safety margin. It wasn't. Small wins and small losses leave little room for costs, so always read both numbers after fees, not before.
Small samples blow up profit factor
Profit factor divides by gross loss, and a small denominator makes the ratio jumpy. Take ten trades: nine wins of 0.5R and one loss of 0.5R. Profit factor is 9.0 and expectancy is 0.40R. Add one more trade, a 1R loss. Profit factor drops to 3.0, a fall of two thirds. Expectancy drops to 0.27R, a fall of one third. With zero losses, profit factor can't be calculated at all.
Neither number means much on ten trades, but profit factor exaggerates the noise more. Our post on how many trades you need to judge a strategy shows how wide the error range on expectancy is at different sample sizes.
Position size moves dollar expectancy, not profit factor
Trade the same setup at twice the size and dollar expectancy doubles while profit factor stays put. That makes dollar expectancy a poor way to compare setups you size differently, and it is the main argument for measuring expectancy in R. In R, a bigger position doesn't make a setup look better.
Profit factor or expectancy: which tells you more?
Expectancy in R, net of costs, tells you more. It answers the question you actually care about: how much does one more trade of this setup add, per unit of risk? Multiply it by how many trades you take and you get a planning number. If Setup A fires 100 times a month and Setup B only 25, A adds about 32R a month against B's 14.4R, even though B has the bigger edge per trade. Profit factor can't do that arithmetic.
Profit factor still earns its place as a second opinion:
- It ignores position size, so it compares accounts and setups traded at different sizes.
- It is a fast sanity check. A profit factor close to 1.0 tells you the edge is thin before you open any other report.
- It matches platform reports. MetaTrader and most backtesting tools print it, so you can compare your journal to a test.
Read it next to the payoff ratio and win rate to see where it comes from, the same way our post on why a 70% win rate can still lose money reads win rate.
How to read both on your own trades
- Measure in R, after costs. Use your planned stop as 1R and include commissions and slippage in every result. Our guide on how to calculate expectancy walks through it in a spreadsheet.
- Split by setup. A blended account number can average a Setup A and a Setup B into something that describes neither.
- Check the denominator. If a setup has fewer than 20 or so losses, treat its profit factor as a rough guess.
- Remove the biggest winner and recompute. If either number collapses, one trade is carrying the result.
- When they disagree, look at the average loss. A high profit factor with modest expectancy almost always means small losses and small wins. Decide whether that holds up after costs.
For the full order to read a dashboard in, see our list of trading performance metrics worth tracking.
See profit factor and expectancy by setup
JournalX calculates profit factor, expectancy in R, win rate and average win and loss for every setup automatically, so you can see when the two numbers disagree and why.
Frequently asked questions
Is profit factor or expectancy better?
Expectancy, measured in R and net of costs, is the better single number because it tells you how much each trade earns per unit of risk, which you can multiply by your trade count. Profit factor is a useful second check because it is a ratio that ignores position size, but it can rank setups in the wrong order and swings hard on small samples.
Can a strategy have a high profit factor and low expectancy?
Yes. A setup that takes small wins and even smaller losses can show a profit factor of 3.0 while earning only 0.3R per trade, less than a setup with a profit factor of 1.9 that earns almost 0.6R per trade. Profit factor is a ratio of wins to losses, so it rewards small losses, not a large edge per trade.
How do you convert profit factor to expectancy?
Expectancy equals the loss rate times the average loss times profit factor minus one. With a 40 percent loss rate, a 1R average loss and a profit factor of 1.5, expectancy is 0.4 times 1 times 0.5, which is 0.2R per trade. You need the loss rate and average loss as well, because profit factor alone does not contain the size of the trades.
Do profit factor and expectancy ever disagree on whether a strategy is profitable?
No. A profit factor above 1.0 always means positive expectancy, and a profit factor below 1.0 always means negative expectancy, because both are built from the same gross profit and gross loss. They only disagree on how good a strategy is, and on which of two profitable setups is better.
More articles

Performance & Analytics
The Trading Performance Metrics
Trading performance metrics grouped by the question each one answers, from edge to drawdown, sizing and execution. Formulas, good ranges and a worked example.
Performance & Analytics
How Many Trades Do You Need to
How many trades to evaluate a trading strategy? Usually 100 to 400, not 20. The sample-size math for win rate and expectancy, with a formula for your own numbers.