The Trading Performance Metrics Worth Tracking
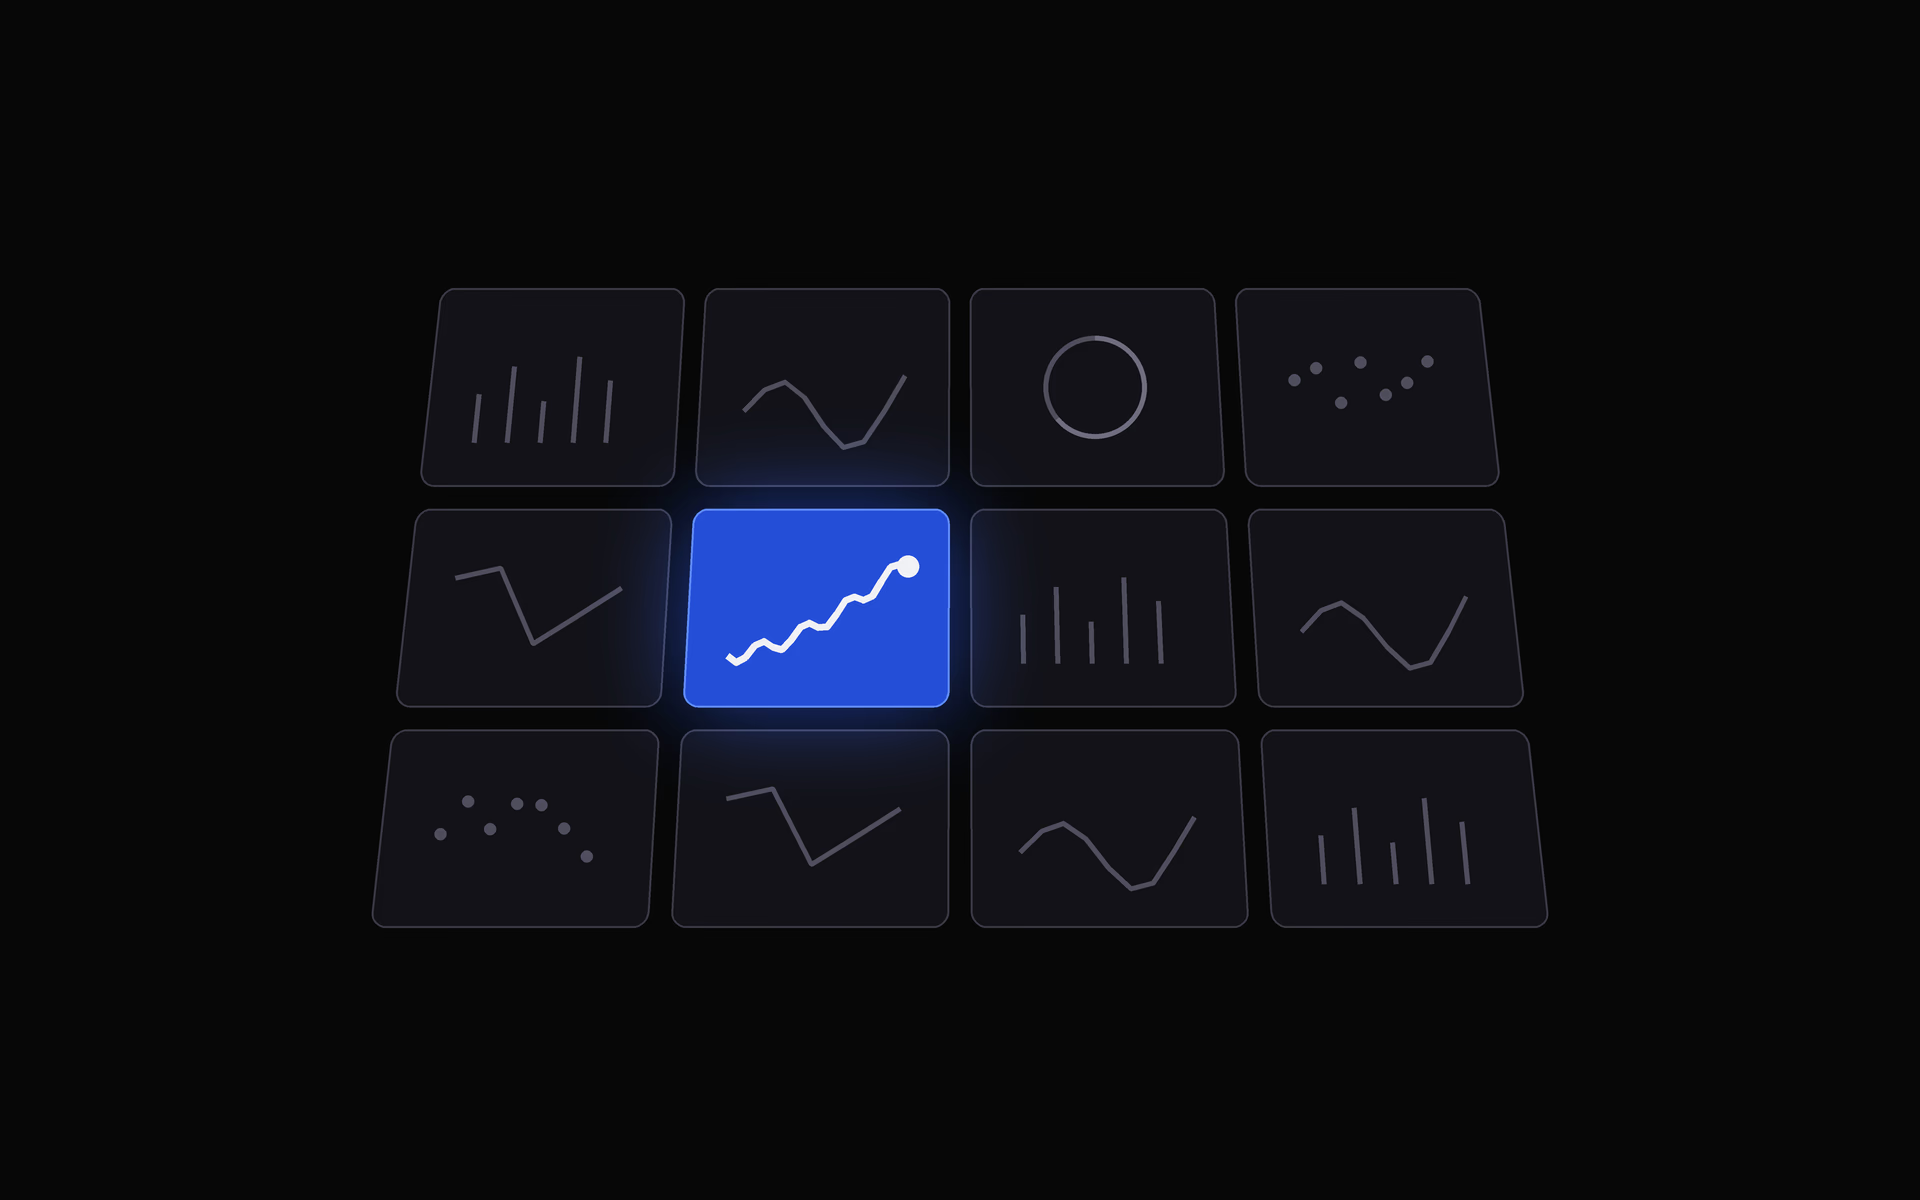
Trading performance metrics grouped by the question each one answers, from edge to drawdown, sizing and execution. Formulas, good ranges and a worked example.
Most trading dashboards show twenty numbers at once, and most traders read the two that feel best that week. The fix is not more trading performance metrics. It is knowing which question each one answers, so you can read them in order and stop when one fails. This post groups them that way, with the formula for each, then runs all of them on one example journal.
Measure everything in R first
Before any metric, put every trade on the same scale. An R-multiple is a trade's result divided by the amount you planned to risk, the distance from entry to your stop-loss times position size. A $300 win on $100 of risk is +3R, a full stop-out is −1R.
Dollar figures mix up how well the strategy works with how big you happened to trade. In R, a strategy that kept working after you doubled your size looks the same in both periods. Every metric below works in R.
1. Do I have an edge?
- Expectancy is the average result per trade: (win rate × average win) − (loss rate × average loss). Above zero means the strategy made money per trade over the sample. It is the single most important number in the journal. Our guide on how to calculate expectancy works it by hand and in a spreadsheet.
- Profit factor is gross profit ÷ gross loss. Above 1.0 is profitable, and 1.5 to 2.0 is generally considered strong. It tells the same story as expectancy from a different angle: dollars made per dollar lost.
- System Quality Number (SQN) is average R ÷ standard deviation of R × √trades, usually capped at 100. Van Tharp's scale calls 2.0 to 2.4 average and 2.5 to 2.9 good. It answers a sharper question than expectancy: is the edge big compared with the noise around it?
None of these mean much on a small sample. A typical setup needs 100 to 400 trades before a positive expectancy stands clear of zero.
2. What do my wins and losses look like?
These show how the edge is built, which tells you what to protect.
- Win rate is winning trades ÷ total trades.
- Average win and average loss are the typical size of each. Their ratio, average win ÷ average loss, is often called the payoff ratio.
- Win/loss ratio is the count of wins ÷ the count of losses. It is not the payoff ratio, and mixing the two up is common.
- Risk-reward ratio is the planned version of the payoff: stop distance against target distance, set before entry. Comparing planned reward with realized average win shows whether your exits deliver what the plan promised.
The key relationship is the breakeven win rate: 1 ÷ (1 + payoff ratio). With 2R winners and 1R losers you break even at 33% winners. That is why a high win rate on its own proves nothing, which we work through in why a 70% win rate can still lose money.
3. How rough is the ride?
Two strategies with the same expectancy can feel completely different to trade. These metrics measure the path.
- Maximum drawdown is the largest peak-to-trough fall in equity. It is the number that tests whether you will keep following the rules.
- Equity curve is the picture behind every number here. Look at it before the ratios: long flat stretches, a single trade carrying the whole result, or a slope that changed halfway through all show up there first.
- Recovery factor is net profit ÷ maximum drawdown: how many times the strategy earned back its worst fall. It grows with time, so only compare it over equal periods.
- Sharpe ratio is average return above the risk-free rate ÷ standard deviation of returns, usually from daily returns and annualized. William Sharpe's own definition is the reference. Above 1 is commonly treated as good, but only over a long record.
- Sortino ratio is the same idea using only downside deviation, so a strategy with big winning days isn't penalized for them.
Losing streaks belong here too. A strategy that wins 40% of the time typically sees a longest streak of about 11 losses in 500 trades, and one trader in ten sees 14. Our post on losing streaks has the table by win rate.
4. Can I survive my sizing?
An edge only pays if you are still trading when it shows up.
- Risk per trade is the share of the account lost if the stop is hit, usually 0.5% to 2%. It turns a drawdown in R into a drawdown in percent: at 1% risk, an 8R drawdown costs about 8% of the account.
- Position sizing is how that risk becomes a quantity: risk budget ÷ stop distance. Track it to catch trades where size drifted from the rule.
- Risk of ruin is the probability that a normal losing run takes the account past a limit you can't trade through. It is driven far more by risk per trade than by the strategy.
- Kelly criterion is W − (1 − W) ÷ R, the growth-maximizing risk per trade. It is useful as a ceiling, not a target, since it assumes you know your true win rate and payoff exactly.
- Max daily loss is a rule rather than a metric, but logging how often you hit it, and what happened on the days you ignored it, belongs in the review.
5. Am I executing the plan?
The last group separates the strategy from the person running it.
- Maximum adverse excursion (MAE) is how far each trade went against you. It shows whether stops are too tight or too loose.
- Maximum favorable excursion (MFE) is how far each trade went your way. Compared with the exit, it shows how much of the move your exits keep.
- Slippage is fill price against intended price. Measured in R, it shows what execution costs per trade, which can be most of a thin edge.
- Holding period is time in the trade. Closing winners fast while letting losers run long is a pattern worth catching early.
- Results by setup split every metric above by the pattern you traded. A blended expectancy often hides one setup paying for another.
- Plan followed % is the share of trades that matched your trading plan. Then compare expectancy on followed trades with expectancy on rule breaks.
One journal, every metric
Here is a hypothetical 100-trade sample run through every group. Each trade risked 1% of the account.
| Question | Metric | Result | Reading |
|---|---|---|---|
| Edge | Expectancy | +0.40R | Positive, about 40R over 100 trades |
| Edge | Profit factor | 1.72 | 94.5R won against 55R lost |
| Edge | SQN (SD of 1.55R) | 2.5 | Good on Tharp's scale |
| Wins and losses | Win rate | 45% | 45 wins, 55 losses |
| Wins and losses | Average win / average loss | +2.1R / −1.0R | Payoff ratio of 2.1 |
| Wins and losses | Win/loss ratio | 0.82 | More losses than wins, and that is fine |
| Wins and losses | Breakeven win rate | 32% | 13 points of room below the actual 45% |
| Ride | Maximum drawdown | 8R | About 8% of the account at 1% risk |
| Ride | Recovery factor | 4.9 | 39.5R net ÷ 8R drawdown |
| Ride | Longest losing streak | 7 trades | Inside the normal range for a 45% win rate |
| Sizing | Full Kelly | 19% | Far above the 1% actually risked |
Read in order, this is a clear story. The edge is real and decent for its sample size. It comes from a payoff ratio of 2.1, not from being right often, so the thing to protect is the size of the winners: cutting them early would hurt more than a lower win rate. The drawdown is modest at 1% risk, and full Kelly sits far above the risk taken, so sizing is not the problem. That is not a reason to size up.
What the table cannot say is whether the trader followed the plan. That is the job of the fifth group, and it is where most of the useful changes come from.
Mistakes that make good metrics lie
- Judging on too few trades. Twenty trades can show a 70% win rate from a coin-flip strategy. Track the count next to every metric.
- Blending setups. One expectancy across four setups is an average of four different businesses. Split before deciding anything.
- Leaving out costs. Commissions and slippage come off every trade. A +0.15R edge before costs can be zero after them.
- Watching one number. Tight targets raise win rate and shrink payoff. Any single metric can be bought by making another worse.
- Comparing different periods. Recovery factor, net profit and streak length all grow with time. Compare like with like.
For a routine that uses these metrics in order every month, see how to analyze your trading performance and the monthly trading review. For a sense of how standard these figures are, the MetaTrader 5 strategy tester report prints profit factor, expected payoff, recovery factor and Sharpe ratio for every backtest.
See your metrics, split by setup
JournalX calculates expectancy, win rate, profit factor and drawdown from your synced trades, and its filters let you split any of them by setup, session or whether you followed your Gameplan.
Frequently asked questions
What are the most important trading performance metrics?
Start with expectancy, the average result per trade, because it says whether you have an edge at all. Then read win rate with average win and average loss to see how that edge is built, maximum drawdown to see what it costs to hold, and risk per trade to see whether your sizing can survive a normal losing streak. Everything else adds detail to those four.
Is win rate a good measure of trading performance?
Not on its own. A 70 percent win rate loses money if the average loss is three times the average win, and a 35 percent win rate can be very profitable with 3R winners. Win rate only means something next to average win and average loss, or folded into expectancy.
What is a good profit factor for a trading strategy?
Above 1.0 means gross profit exceeds gross loss, so the strategy made money over the sample. Between about 1.5 and 2.0 is generally considered strong for an active strategy. Very high readings on a small sample usually mean a few big winners, so check the trade count before trusting it.
How many trades do you need before performance metrics mean anything?
For a typical setup, somewhere between 100 and 400 trades before expectancy stands clear of zero. Twenty or thirty trades are enough to check that the data is clean and the rules are being followed, but the metrics will still swing widely from one batch to the next.
Should I measure trading performance in dollars or in R?
Use R, meaning each result divided by the amount you planned to risk. R puts a small trade and a large trade on the same scale, so changes in position size don't distort win size, expectancy or drawdown. Keep dollar P&L next to it for the account itself.
More articles
Performance & Analytics
How Many Trades Do You Need to
How many trades to evaluate a trading strategy? Usually 100 to 400, not 20. The sample-size math for win rate and expectancy, with a formula for your own numbers.
Performance & Analytics
Why a 70% Win Rate Can Still
A 70% win rate sounds unbeatable, yet it can still lose money. Here is the win rate vs expectancy math that decides your account, with worked examples.